Bayesian analysis
ERM
2023-11-06
Last updated: 2023-11-06
Checks: 7 0
Knit directory: Cardiotoxicity/
This reproducible R Markdown analysis was created with workflowr (version 1.7.1). The Checks tab describes the reproducibility checks that were applied when the results were created. The Past versions tab lists the development history.
Great! Since the R Markdown file has been committed to the Git repository, you know the exact version of the code that produced these results.
Great job! The global environment was empty. Objects defined in the global environment can affect the analysis in your R Markdown file in unknown ways. For reproduciblity it’s best to always run the code in an empty environment.
The command set.seed(20230109) was run prior to running
the code in the R Markdown file. Setting a seed ensures that any results
that rely on randomness, e.g. subsampling or permutations, are
reproducible.
Great job! Recording the operating system, R version, and package versions is critical for reproducibility.
Nice! There were no cached chunks for this analysis, so you can be confident that you successfully produced the results during this run.
Great job! Using relative paths to the files within your workflowr project makes it easier to run your code on other machines.
Great! You are using Git for version control. Tracking code development and connecting the code version to the results is critical for reproducibility.
The results in this page were generated with repository version ae9124e. See the Past versions tab to see a history of the changes made to the R Markdown and HTML files.
Note that you need to be careful to ensure that all relevant files for
the analysis have been committed to Git prior to generating the results
(you can use wflow_publish or
wflow_git_commit). workflowr only checks the R Markdown
file, but you know if there are other scripts or data files that it
depends on. Below is the status of the Git repository when the results
were generated:
Ignored files:
    Ignored:    .RData
    Ignored:    .Rhistory
    Ignored:    .Rproj.user/
    Ignored:    data/41588_2018_171_MOESM3_ESMeQTL_ST2_for paper.csv
    Ignored:    data/Arr_GWAS.txt
    Ignored:    data/Arr_geneset.RDS
    Ignored:    data/BC_cell_lines.csv
    Ignored:    data/BurridgeDOXTOX.RDS
    Ignored:    data/CADGWASgene_table.csv
    Ignored:    data/CAD_geneset.RDS
    Ignored:    data/CALIMA_Data/
    Ignored:    data/Clamp_Summary.csv
    Ignored:    data/Cormotif_24_k1-5_raw.RDS
    Ignored:    data/Counts_RNA_ERMatthews.txt
    Ignored:    data/DAgostres24.RDS
    Ignored:    data/DAtable1.csv
    Ignored:    data/DDEMresp_list.csv
    Ignored:    data/DDE_reQTL.txt
    Ignored:    data/DDEresp_list.csv
    Ignored:    data/DEG-GO/
    Ignored:    data/DEG_cormotif.RDS
    Ignored:    data/DF_Plate_Peak.csv
    Ignored:    data/DRC48hoursdata.csv
    Ignored:    data/Da24counts.txt
    Ignored:    data/Dx24counts.txt
    Ignored:    data/Dx_reQTL_specific.txt
    Ignored:    data/EPIstorelist24.RDS
    Ignored:    data/Ep24counts.txt
    Ignored:    data/Full_LD_rep.csv
    Ignored:    data/GOIsig.csv
    Ignored:    data/GOplots.R
    Ignored:    data/GTEX_setsimple.csv
    Ignored:    data/GTEX_sig24.RDS
    Ignored:    data/GTEx_gene_list.csv
    Ignored:    data/HFGWASgene_table.csv
    Ignored:    data/HF_geneset.RDS
    Ignored:    data/Heart_Left_Ventricle.v8.egenes.txt
    Ignored:    data/Heatmap_mat.RDS
    Ignored:    data/Heatmap_sig.RDS
    Ignored:    data/Hf_GWAS.txt
    Ignored:    data/K_cluster
    Ignored:    data/K_cluster_kisthree.csv
    Ignored:    data/K_cluster_kistwo.csv
    Ignored:    data/LD50_05via.csv
    Ignored:    data/LDH48hoursdata.csv
    Ignored:    data/Mt24counts.txt
    Ignored:    data/NoRespDEG_final.csv
    Ignored:    data/RINsamplelist.txt
    Ignored:    data/RNA_seq_trial.RDS
    Ignored:    data/Seonane2019supp1.txt
    Ignored:    data/TMMnormed_x.RDS
    Ignored:    data/TOP2Bi-24hoursGO_analysis.csv
    Ignored:    data/TR24counts.txt
    Ignored:    data/TableS10.csv
    Ignored:    data/TableS11.csv
    Ignored:    data/TableS9.csv
    Ignored:    data/Top2biresp_cluster24h.csv
    Ignored:    data/Var_test_list.RDS
    Ignored:    data/Var_test_list24.RDS
    Ignored:    data/Var_test_list24alt.RDS
    Ignored:    data/Var_test_list3.RDS
    Ignored:    data/Vargenes.RDS
    Ignored:    data/Viabilitylistfull.csv
    Ignored:    data/allexpressedgenes.txt
    Ignored:    data/allfinal3hour.RDS
    Ignored:    data/allgenes.txt
    Ignored:    data/allmatrix.RDS
    Ignored:    data/allmymatrix.RDS
    Ignored:    data/annotation_data_frame.RDS
    Ignored:    data/averageviabilitytable.RDS
    Ignored:    data/avgLD50.RDS
    Ignored:    data/avg_LD50.RDS
    Ignored:    data/backGL.txt
    Ignored:    data/burr_genes.RDS
    Ignored:    data/calcium_data.RDS
    Ignored:    data/clamp_summary.RDS
    Ignored:    data/cormotif_3hk1-8.RDS
    Ignored:    data/cormotif_initalK5.RDS
    Ignored:    data/cormotif_initialK5.RDS
    Ignored:    data/cormotif_initialall.RDS
    Ignored:    data/cormotifprobs.csv
    Ignored:    data/counts24hours.RDS
    Ignored:    data/cpmcount.RDS
    Ignored:    data/cpmnorm_counts.csv
    Ignored:    data/crispr_genes.csv
    Ignored:    data/ctnnt_results.txt
    Ignored:    data/cvd_GWAS.txt
    Ignored:    data/dat_cpm.RDS
    Ignored:    data/data_outline.txt
    Ignored:    data/drug_noveh1.csv
    Ignored:    data/efit2.RDS
    Ignored:    data/efit2_final.RDS
    Ignored:    data/efit2results.RDS
    Ignored:    data/ensembl_backup.RDS
    Ignored:    data/ensgtotal.txt
    Ignored:    data/filcpm_counts.RDS
    Ignored:    data/filenameonly.txt
    Ignored:    data/filtered_cpm_counts.csv
    Ignored:    data/filtered_raw_counts.csv
    Ignored:    data/filtermatrix_x.RDS
    Ignored:    data/folder_05top/
    Ignored:    data/geneDoxonlyQTL.csv
    Ignored:    data/gene_corr_df.RDS
    Ignored:    data/gene_corr_frame.RDS
    Ignored:    data/gene_prob_tran3h.RDS
    Ignored:    data/gene_probabilityk5.RDS
    Ignored:    data/geneset_24.RDS
    Ignored:    data/gostresTop2bi_ER.RDS
    Ignored:    data/gostresTop2bi_LR
    Ignored:    data/gostresTop2bi_LR.RDS
    Ignored:    data/gostresTop2bi_TI.RDS
    Ignored:    data/gostrescoNR
    Ignored:    data/gtex/
    Ignored:    data/heartgenes.csv
    Ignored:    data/hsa_kegg_anno.RDS
    Ignored:    data/individualDRCfile.RDS
    Ignored:    data/individual_DRC48.RDS
    Ignored:    data/individual_LDH48.RDS
    Ignored:    data/indv_noveh1.csv
    Ignored:    data/kegglistDEG.RDS
    Ignored:    data/kegglistDEG24.RDS
    Ignored:    data/kegglistDEG3.RDS
    Ignored:    data/knowfig4.csv
    Ignored:    data/knowfig5.csv
    Ignored:    data/label_list.RDS
    Ignored:    data/ld50_table.csv
    Ignored:    data/mean_vardrug1.csv
    Ignored:    data/mean_varframe.csv
    Ignored:    data/mymatrix.RDS
    Ignored:    data/new_ld50avg.RDS
    Ignored:    data/nonresponse_cluster24h.csv
    Ignored:    data/norm_LDH.csv
    Ignored:    data/norm_counts.csv
    Ignored:    data/old_sets/
    Ignored:    data/organized_drugframe.csv
    Ignored:    data/plan2plot.png
    Ignored:    data/plot_intv_list.RDS
    Ignored:    data/plot_list_DRC.RDS
    Ignored:    data/qval24hr.RDS
    Ignored:    data/qval3hr.RDS
    Ignored:    data/qvalueEPItemp.RDS
    Ignored:    data/raw_counts.csv
    Ignored:    data/response_cluster24h.csv
    Ignored:    data/sigVDA24.txt
    Ignored:    data/sigVDA3.txt
    Ignored:    data/sigVDX24.txt
    Ignored:    data/sigVDX3.txt
    Ignored:    data/sigVEP24.txt
    Ignored:    data/sigVEP3.txt
    Ignored:    data/sigVMT24.txt
    Ignored:    data/sigVMT3.txt
    Ignored:    data/sigVTR24.txt
    Ignored:    data/sigVTR3.txt
    Ignored:    data/siglist.RDS
    Ignored:    data/siglist_final.RDS
    Ignored:    data/siglist_old.RDS
    Ignored:    data/slope_table.csv
    Ignored:    data/supp10_24hlist.RDS
    Ignored:    data/supp10_3hlist.RDS
    Ignored:    data/supp_normLDH48.RDS
    Ignored:    data/supp_pca_all_anno.RDS
    Ignored:    data/table3a.omar
    Ignored:    data/test_run_sample_list.txt
    Ignored:    data/testlist.txt
    Ignored:    data/toplistall.RDS
    Ignored:    data/trtonly_24h_genes.RDS
    Ignored:    data/trtonly_3h_genes.RDS
    Ignored:    data/tvl24hour.txt
    Ignored:    data/tvl24hourw.txt
    Ignored:    data/venn_code.R
    Ignored:    data/viability.RDS

Untracked files:
    Untracked:  .RDataTmp
    Untracked:  .RDataTmp1
    Untracked:  .RDataTmp2
    Untracked:  .RDataTmp3
    Untracked:  3hr all.pdf
    Untracked:  Code_files_list.csv
    Untracked:  Data_files_list.csv
    Untracked:  Doxorubicin_vehicle_3_24.csv
    Untracked:  Doxtoplist.csv
    Untracked:  EPIqvalue_analysis.Rmd
    Untracked:  GWAS_list_of_interest.xlsx
    Untracked:  KEGGpathwaylist.R
    Untracked:  OmicNavigator_learn.R
    Untracked:  SigDoxtoplist.csv
    Untracked:  analysis/ciFIT.R
    Untracked:  analysis/export_to_excel.R
    Untracked:  analysis/featureCountsPLAY.R
    Untracked:  cleanupfiles_script.R
    Untracked:  code/biomart_gene_names.R
    Untracked:  code/constantcode.R
    Untracked:  code/corMotifcustom.R
    Untracked:  code/cpm_boxplot.R
    Untracked:  code/extracting_ggplot_data.R
    Untracked:  code/movingfilesto_ppl.R
    Untracked:  code/pearson_extract_func.R
    Untracked:  code/pearson_tox_extract.R
    Untracked:  code/plot1C.fun.R
    Untracked:  code/spearman_extract_func.R
    Untracked:  code/venndiagramcolor_control.R
    Untracked:  cormotif_p.post.list_4.csv
    Untracked:  figS1024h.pdf
    Untracked:  individual-legenddark2.png
    Untracked:  installed_old.rda
    Untracked:  motif_ER.txt
    Untracked:  motif_LR.txt
    Untracked:  motif_NR.txt
    Untracked:  motif_TI.txt
    Untracked:  output/DNR_DEGlist.csv
    Untracked:  output/DNRvenn.RDS
    Untracked:  output/DOX_DEGlist.csv
    Untracked:  output/DOXvenn.RDS
    Untracked:  output/EPI_DEGlist.csv
    Untracked:  output/EPIvenn.RDS
    Untracked:  output/Figures/
    Untracked:  output/MTX_DEGlist.csv
    Untracked:  output/MTXvenn.RDS
    Untracked:  output/TRZ_DEGlist.csv
    Untracked:  output/TableS8.csv
    Untracked:  output/Volcanoplot_10
    Untracked:  output/Volcanoplot_10.RDS
    Untracked:  output/allfinal_sup10.RDS
    Untracked:  output/endocytosisgenes.csv
    Untracked:  output/gene_corr_fig9.RDS
    Untracked:  output/legend_b.RDS
    Untracked:  output/motif_ERrep.RDS
    Untracked:  output/motif_LRrep.RDS
    Untracked:  output/motif_NRrep.RDS
    Untracked:  output/motif_TI_rep.RDS
    Untracked:  output/output-old/
    Untracked:  output/rank24genes.csv
    Untracked:  output/rank3genes.csv
    Untracked:  output/reneem@ls6.tacc.utexas.edu
    Untracked:  output/sequencinginformationforsupp.csv
    Untracked:  output/sequencinginformationforsupp.prn
    Untracked:  output/sigVDA24.txt
    Untracked:  output/sigVDA3.txt
    Untracked:  output/sigVDX24.txt
    Untracked:  output/sigVDX3.txt
    Untracked:  output/sigVEP24.txt
    Untracked:  output/sigVEP3.txt
    Untracked:  output/sigVMT24.txt
    Untracked:  output/sigVMT3.txt
    Untracked:  output/sigVTR24.txt
    Untracked:  output/sigVTR3.txt
    Untracked:  output/supplementary_motif_list_GO.RDS
    Untracked:  output/toptablebydrug.RDS
    Untracked:  output/tvl24hour.txt
    Untracked:  output/x_counts.RDS
    Untracked:  reneebasecode.R

Unstaged changes:
    Modified:   analysis/GOI_plots.Rmd
    Modified:   output/daplot.RDS
    Modified:   output/dxplot.RDS
    Modified:   output/epplot.RDS
    Modified:   output/mtplot.RDS
    Modified:   output/plan2plot.png
    Modified:   output/trplot.RDS
    Modified:   output/veplot.RDS
Note that any generated files, e.g. HTML, png, CSS, etc., are not included in this status report because it is ok for generated content to have uncommitted changes.
These are the previous versions of the repository in which changes were
made to the R Markdown
(analysis/Cormotifcluster_analysis.Rmd) and HTML
(docs/Cormotifcluster_analysis.html) files. If you’ve
configured a remote Git repository (see ?wflow_git_remote),
click on the hyperlinks in the table below to view the files as they
were in that past version.
| File | Version | Author | Date | Message |
|---|---|---|---|---|
| Rmd | c84a699 | reneeisnowhere | 2023-09-28 | title update |
| html | 3511b8e | reneeisnowhere | 2023-09-25 | Build site. |
| Rmd | 7c03236 | reneeisnowhere | 2023-09-25 | updates to plots and code |
| html | 45073b8 | reneeisnowhere | 2023-07-28 | Build site. |
| Rmd | 023b9cb | reneeisnowhere | 2023-07-28 | new figures update |
| html | c209a8c | reneeisnowhere | 2023-06-30 | Build site. |
| Rmd | 661e5dc | reneeisnowhere | 2023-06-30 | update figures with final counts |
| Rmd | 8a8998f | reneeisnowhere | 2023-06-30 | update changes to genelist (if any) |
| Rmd | f4bd5e1 | reneeisnowhere | 2023-06-27 | checking code changes overtime |
| html | d5076c9 | reneeisnowhere | 2023-06-21 | Build site. |
| Rmd | a8c7dfb | reneeisnowhere | 2023-06-21 | adding legend |
| html | 89bc24d | reneeisnowhere | 2023-06-02 | Build site. |
| Rmd | ba8f440 | reneeisnowhere | 2023-06-02 | update plot |
| html | bc9a824 | reneeisnowhere | 2023-06-02 | Build site. |
| Rmd | 2aca0d8 | reneeisnowhere | 2023-06-02 | adding in LFC plot to show magnitude of effect |
| Rmd | 2be1117 | reneeisnowhere | 2023-05-31 | updating pie charts and lfc to remove significance test |
| html | 4393a05 | reneeisnowhere | 2023-05-26 | Build site. |
| Rmd | ac69e6e | reneeisnowhere | 2023-05-26 | adding abs LFC of motifs |
| Rmd | f3871a5 | reneeisnowhere | 2023-05-26 | updates |
| html | 71f4c17 | reneeisnowhere | 2023-05-25 | Build site. |
| Rmd | 43b7b74 | reneeisnowhere | 2023-05-25 | update pie chart with ggplot |
| Rmd | e8c82ec | reneeisnowhere | 2023-05-18 | adding other_analysis and genes of interest log2cpm |
| html | 0835f9c | reneeisnowhere | 2023-05-17 | Build site. |
| Rmd | 4edac57 | reneeisnowhere | 2023-05-17 | adding piechart and barchart |
| html | f0bbc78 | reneeisnowhere | 2023-04-19 | Build site. |
| Rmd | 5ce3414 | reneeisnowhere | 2023-04-19 | updated Cormotif |
| html | f4a33f1 | reneeisnowhere | 2023-04-19 | Build site. |
| Rmd | b117da5 | reneeisnowhere | 2023-04-19 | updated Cormotif |
| html | 22246d9 | reneeisnowhere | 2023-04-18 | Build site. |
| Rmd | 6f6aaf4 | reneeisnowhere | 2023-04-18 | new Cormotif analysis with codes |
| html | d0f459b | reneeisnowhere | 2023-04-18 | Build site. |
| Rmd | 67b2a09 | reneeisnowhere | 2023-04-18 | new Cormotif analysis with codes |
| Rmd | a64bbe1 | reneeisnowhere | 2023-04-18 | updated with new cormotif method |
| html | 9e37491 | reneeisnowhere | 2023-04-16 | Build site. |
| Rmd | 6d925a2 | reneeisnowhere | 2023-04-16 | updating cormotif with updated RNAseq counts |
| Rmd | 4e52216 | reneeisnowhere | 2023-03-31 | End of week updates |
| Rmd | c365253 | reneeisnowhere | 2023-03-22 | updated code and plots |
| Rmd | 3a26d52 | reneeisnowhere | 2023-03-22 | Wed poster analysis changes |
| Rmd | a150323 | reneeisnowhere | 2023-03-20 | addingcormotif analysis and go on DEGs |
library(tidyverse)
library(gprofiler2)
library(readr)
library(BiocGenerics)
library(gridExtra)
library(VennDiagram)
library(kableExtra)
library(scales)
library(ggVennDiagram)
library(Cormotif)
library(RColorBrewer)
library(ggpubr)
Creation of the data set:
## Fit limma model using code as it is found in the original cormotif code. It has
## only been modified to add names to the matrix of t values, as well as the
## limma fits

limmafit.default <- function(exprs,groupid,compid) {
  limmafits  <- list()
  compnum    <- nrow(compid)
  genenum    <- nrow(exprs)
  limmat     <- matrix(0,genenum,compnum)
  limmas2    <- rep(0,compnum)
  limmadf    <- rep(0,compnum)
  limmav0    <- rep(0,compnum)
  limmag1num <- rep(0,compnum)
  limmag2num <- rep(0,compnum)

  rownames(limmat)  <- rownames(exprs)
  colnames(limmat)  <- rownames(compid)
  names(limmas2)    <- rownames(compid)
  names(limmadf)    <- rownames(compid)
  names(limmav0)    <- rownames(compid)
  names(limmag1num) <- rownames(compid)
  names(limmag2num) <- rownames(compid)

  for(i in 1:compnum) {
    selid1 <- which(groupid == compid[i,1])
    selid2 <- which(groupid == compid[i,2])
    eset   <- new("ExpressionSet", exprs=cbind(exprs[,selid1],exprs[,selid2]))
    g1num  <- length(selid1)
    g2num  <- length(selid2)
    designmat <- cbind(base=rep(1,(g1num+g2num)), delta=c(rep(0,g1num),rep(1,g2num)))
    fit <- lmFit(eset,designmat)
    fit <- eBayes(fit)
    limmat[,i] <- fit$t[,2]
    limmas2[i] <- fit$s2.prior
    limmadf[i] <- fit$df.prior
    limmav0[i] <- fit$var.prior[2]
    limmag1num[i] <- g1num
    limmag2num[i] <- g2num
    limmafits[[i]] <- fit

    # log odds
    # w<-sqrt(1+fit$var.prior[2]/(1/g1num+1/g2num))
    # log(0.99)+dt(fit$t[1,2],g1num+g2num-2+fit$df.prior,log=TRUE)-log(0.01)-dt(fit$t[1,2]/w, g1num+g2num-2+fit$df.prior, log=TRUE)+log(w)
  }
  names(limmafits) <- rownames(compid)
  limmacompnum<-nrow(compid)
  result<-list(t       = limmat,
               v0      = limmav0,
               df0     = limmadf,
               s20     = limmas2,
               g1num   = limmag1num,
               g2num   = limmag2num,
               compnum = limmacompnum,
               fits    = limmafits)
}

limmafit.counts <-
  function (exprs, groupid, compid, norm.factor.method = "TMM", voom.normalize.method = "none")
  {
    limmafits  <- list()
    compnum    <- nrow(compid)
    genenum    <- nrow(exprs)
    limmat     <- matrix(NA,genenum,compnum)
    limmas2    <- rep(0,compnum)
    limmadf    <- rep(0,compnum)
    limmav0    <- rep(0,compnum)
    limmag1num <- rep(0,compnum)
    limmag2num <- rep(0,compnum)

    rownames(limmat)  <- rownames(exprs)
    colnames(limmat)  <- rownames(compid)
    names(limmas2)    <- rownames(compid)
    names(limmadf)    <- rownames(compid)
    names(limmav0)    <- rownames(compid)
    names(limmag1num) <- rownames(compid)
    names(limmag2num) <- rownames(compid)

    for (i in 1:compnum) {
      message(paste("Running limma for comparision",i,"/",compnum))
      selid1 <- which(groupid == compid[i, 1])
      selid2 <- which(groupid == compid[i, 2])
      # make a new count data frame
      counts <- cbind(exprs[, selid1], exprs[, selid2])

      # remove NAs
      not.nas <- which(apply(counts, 1, function(x) !any(is.na(x))) == TRUE)

      # runn voom/limma
      d <- DGEList(counts[not.nas,])
      d <- calcNormFactors(d, method = norm.factor.method)
      g1num <- length(selid1)
      g2num <- length(selid2)
      designmat <- cbind(base = rep(1, (g1num + g2num)), delta = c(rep(0,
                                                                       g1num), rep(1, g2num)))

      y <- voom(d, designmat, normalize.method = voom.normalize.method)
      fit <- lmFit(y, designmat)
      fit <- eBayes(fit)

      limmafits[[i]] <- fit
      limmat[not.nas, i] <- fit$t[, 2]
      limmas2[i] <- fit$s2.prior
      limmadf[i] <- fit$df.prior
      limmav0[i] <- fit$var.prior[2]
      limmag1num[i] <- g1num
      limmag2num[i] <- g2num
    }
    limmacompnum <- nrow(compid)
    names(limmafits) <- rownames(compid)
    result <- list(t       = limmat,
                   v0      = limmav0,
                   df0     = limmadf,
                   s20     = limmas2,
                   g1num   = limmag1num,
                   g2num   = limmag2num,
                   compnum = limmacompnum,
                   fits    = limmafits)
  }

limmafit.list <-
  function (fitlist, cmp.idx=2)
  {
    compnum    <- length(fitlist)

    genes <- c()
    for (i in 1:compnum) genes <- unique(c(genes, rownames(fitlist[[i]])))

    genenum    <- length(genes)
    limmat     <- matrix(NA,genenum,compnum)
    limmas2    <- rep(0,compnum)
    limmadf    <- rep(0,compnum)
    limmav0    <- rep(0,compnum)
    limmag1num <- rep(0,compnum)
    limmag2num <- rep(0,compnum)

    rownames(limmat)  <- genes
    colnames(limmat)  <- names(fitlist)
    names(limmas2)    <- names(fitlist)
    names(limmadf)    <- names(fitlist)
    names(limmav0)    <- names(fitlist)
    names(limmag1num) <- names(fitlist)
    names(limmag2num) <- names(fitlist)

    for (i in 1:compnum) {
      this.t <- fitlist[[i]]$t[,cmp.idx]
      limmat[names(this.t),i] <- this.t

      limmas2[i]    <- fitlist[[i]]$s2.prior
      limmadf[i]    <- fitlist[[i]]$df.prior
      limmav0[i]    <- fitlist[[i]]$var.prior[cmp.idx]
      limmag1num[i] <- sum(fitlist[[i]]$design[,cmp.idx]==0)
      limmag2num[i] <- sum(fitlist[[i]]$design[,cmp.idx]==1)
    }

    limmacompnum <- compnum
    result <- list(t       = limmat,
                   v0      = limmav0,
                   df0     = limmadf,
                   s20     = limmas2,
                   g1num   = limmag1num,
                   g2num   = limmag2num,
                   compnum = limmacompnum,
                   fits    = limmafits)

  }

## Rank genes based on statistics
generank<-function(x) {
  xcol<-ncol(x)
  xrow<-nrow(x)
  result<-matrix(0,xrow,xcol)
  z<-(1:1:xrow)
  for(i in 1:xcol) {
    y<-sort(x[,i],decreasing=TRUE,na.last=TRUE)
    result[,i]<-match(x[,i],y)
    result[,i]<-order(result[,i])
  }
  result
}

## Log-likelihood for moderated t under H0
modt.f0.loglike<-function(x,df) {
  a<-dt(x, df, log=TRUE)
  result<-as.vector(a)
  flag<-which(is.na(result)==TRUE)
  result[flag]<-0
  result
}

## Log-likelihood for moderated t under H1
## param=c(df,g1num,g2num,v0)
modt.f1.loglike<-function(x,param) {
  df<-param[1]
  g1num<-param[2]
  g2num<-param[3]
  v0<-param[4]
  w<-sqrt(1+v0/(1/g1num+1/g2num))
  dt(x/w, df, log=TRUE)-log(w)
  a<-dt(x/w, df, log=TRUE)-log(w)
  result<-as.vector(a)
  flag<-which(is.na(result)==TRUE)
  result[flag]<-0
  result
}

## Correlation Motif Fit
cmfit.X<-function(x, type, K=1, tol=1e-3, max.iter=100) {
  ## initialize
  xrow <- nrow(x)
  xcol <- ncol(x)
  loglike0 <- list()
  loglike1 <- list()
  p <- rep(1, K)/K
  q <- matrix(runif(K * xcol), K, xcol)
  q[1, ] <- rep(0.01, xcol)
  for (i in 1:xcol) {
    f0 <- type[[i]][[1]]
    f0param <- type[[i]][[2]]
    f1 <- type[[i]][[3]]
    f1param <- type[[i]][[4]]
    loglike0[[i]] <- f0(x[, i], f0param)
    loglike1[[i]] <- f1(x[, i], f1param)
  }
  condlike <- list()
  for (i in 1:xcol) {
    condlike[[i]] <- matrix(0, xrow, K)
  }
  loglike.old <- -1e+10
  for (i.iter in 1:max.iter) {
    if ((i.iter%%50) == 0) {
      print(paste("We have run the first ", i.iter, " iterations for K=",
                  K, sep = ""))
    }
    err <- tol + 1
    clustlike <- matrix(0, xrow, K)
    #templike <- matrix(0, xrow, 2)
    templike1 <- rep(0, xrow)
    templike2 <- rep(0, xrow)
    for (j in 1:K) {
      for (i in 1:xcol) {
        templike1 <- log(q[j, i]) + loglike1[[i]]
        templike2 <- log(1 - q[j, i]) + loglike0[[i]]
        tempmax <- Rfast::Pmax(templike1, templike2)

        templike1 <- exp(templike1 - tempmax)
        templike2 <- exp(templike2 - tempmax)

        tempsum <- templike1 + templike2
        clustlike[, j] <- clustlike[, j] + tempmax +
          log(tempsum)
        condlike[[i]][, j] <- templike1/tempsum
      }
      clustlike[, j] <- clustlike[, j] + log(p[j])
    }
    #tempmax <- apply(clustlike, 1, max)
    tempmax <- Rfast::rowMaxs(clustlike, value=TRUE)
    for (j in 1:K) {
      clustlike[, j] <- exp(clustlike[, j] - tempmax)
    }
    #tempsum <- apply(clustlike, 1, sum)
    tempsum <- Rfast::rowsums(clustlike)
    for (j in 1:K) {
      clustlike[, j] <- clustlike[, j]/tempsum
    }
    #p.new <- (apply(clustlike, 2, sum) + 1)/(xrow + K)
    p.new <- (Rfast::colsums(clustlike) + 1)/(xrow + K)
    q.new <- matrix(0, K, xcol)
    for (j in 1:K) {
      clustpsum <- sum(clustlike[, j])
      for (i in 1:xcol) {
        q.new[j, i] <- (sum(clustlike[, j] * condlike[[i]][,
                                                           j]) + 1)/(clustpsum + 2)
      }
    }
    err.p <- max(abs(p.new - p)/p)
    err.q <- max(abs(q.new - q)/q)
    err <- max(err.p, err.q)
    loglike.new <- (sum(tempmax + log(tempsum)) + sum(log(p.new)) +
                      sum(log(q.new) + log(1 - q.new)))/xrow
    p <- p.new
    q <- q.new
    loglike.old <- loglike.new
    if (err < tol) {
      break
    }
  }
  clustlike <- matrix(0, xrow, K)
  for (j in 1:K) {
    for (i in 1:xcol) {
      templike1 <- log(q[j, i]) + loglike1[[i]]
      templike2 <- log(1 - q[j, i]) + loglike0[[i]]
      tempmax <- Rfast::Pmax(templike1, templike2)

      templike1 <- exp(templike1 - tempmax)
      templike2 <- exp(templike2 - tempmax)

      tempsum <- templike1 + templike2
      clustlike[, j] <- clustlike[, j] + tempmax + log(tempsum)
      condlike[[i]][, j] <- templike1/tempsum
    }
    clustlike[, j] <- clustlike[, j] + log(p[j])
  }
  #tempmax <- apply(clustlike, 1, max)
  tempmax <- Rfast::rowMaxs(clustlike, value=TRUE)
  for (j in 1:K) {
    clustlike[, j] <- exp(clustlike[, j] - tempmax)
  }
  #tempsum <- apply(clustlike, 1, sum)
  tempsum <- Rfast::rowsums(clustlike)
  for (j in 1:K) {
    clustlike[, j] <- clustlike[, j]/tempsum
  }
  p.post <- matrix(0, xrow, xcol)
  for (j in 1:K) {
    for (i in 1:xcol) {
      p.post[, i] <- p.post[, i] + clustlike[, j] * condlike[[i]][,
                                                                  j]
    }
  }
  loglike.old <- loglike.old - (sum(log(p)) + sum(log(q) +
                                                    log(1 - q)))/xrow
  loglike.old <- loglike.old * xrow
  result <- list(p.post = p.post, motif.prior = p, motif.q = q,
                 loglike = loglike.old, clustlike=clustlike, condlike=condlike)
}

## Fit using (0,0,...,0) and (1,1,...,1)
cmfitall<-function(x, type, tol=1e-3, max.iter=100) {
  ## initialize
  xrow<-nrow(x)
  xcol<-ncol(x)
  loglike0<-list()
  loglike1<-list()
  p<-0.01

  ## compute loglikelihood
  L0<-matrix(0,xrow,1)
  L1<-matrix(0,xrow,1)
  for(i in 1:xcol) {
    f0<-type[[i]][[1]]
    f0param<-type[[i]][[2]]
    f1<-type[[i]][[3]]
    f1param<-type[[i]][[4]]
    loglike0[[i]]<-f0(x[,i],f0param)
    loglike1[[i]]<-f1(x[,i],f1param)
    L0<-L0+loglike0[[i]]
    L1<-L1+loglike1[[i]]
  }


  ## EM algorithm to get MLE of p and q
  loglike.old <- -1e10
  for(i.iter in 1:max.iter) {
    if((i.iter%%50) == 0) {
      print(paste("We have run the first ", i.iter, " iterations",sep=""))
    }
    err<-tol+1

    ## compute posterior cluster membership
    clustlike<-matrix(0,xrow,2)
    clustlike[,1]<-log(1-p)+L0
    clustlike[,2]<-log(p)+L1

    tempmax<-apply(clustlike,1,max)
    for(j in 1:2) {
      clustlike[,j]<-exp(clustlike[,j]-tempmax)
    }
    tempsum<-apply(clustlike,1,sum)

    ## update motif occurrence rate
    for(j in 1:2) {
      clustlike[,j]<-clustlike[,j]/tempsum
    }

    p.new<-(sum(clustlike[,2])+1)/(xrow+2)

    ## evaluate convergence
    err<-abs(p.new-p)/p

    ## evaluate whether the log.likelihood increases
    loglike.new<-(sum(tempmax+log(tempsum))+log(p.new)+log(1-p.new))/xrow

    loglike.old<-loglike.new
    p<-p.new

    if(err<tol) {
      break;
    }
  }

  ## compute posterior p
  clustlike<-matrix(0,xrow,2)
  clustlike[,1]<-log(1-p)+L0
  clustlike[,2]<-log(p)+L1

  tempmax<-apply(clustlike,1,max)
  for(j in 1:2) {
    clustlike[,j]<-exp(clustlike[,j]-tempmax)
  }
  tempsum<-apply(clustlike,1,sum)

  for(j in 1:2) {
    clustlike[,j]<-clustlike[,j]/tempsum
  }

  p.post<-matrix(0,xrow,xcol)
  for(i in 1:xcol) {
    p.post[,i]<-clustlike[,2]
  }

  ## return

  #calculate back loglikelihood
  loglike.old<-loglike.old-(log(p)+log(1-p))/xrow
  loglike.old<-loglike.old*xrow
  result<-list(p.post=p.post, motif.prior=p, loglike=loglike.old)
}

## Fit each dataset separately
cmfitsep<-function(x, type, tol=1e-3, max.iter=100) {
  ## initialize
  xrow<-nrow(x)
  xcol<-ncol(x)
  loglike0<-list()
  loglike1<-list()
  p<-0.01*rep(1,xcol)
  loglike.final<-rep(0,xcol)

  ## compute loglikelihood
  for(i in 1:xcol) {
    f0<-type[[i]][[1]]
    f0param<-type[[i]][[2]]
    f1<-type[[i]][[3]]
    f1param<-type[[i]][[4]]
    loglike0[[i]]<-f0(x[,i],f0param)
    loglike1[[i]]<-f1(x[,i],f1param)
  }

  p.post<-matrix(0,xrow,xcol)

  ## EM algorithm to get MLE of p
  for(coli in 1:xcol) {
    loglike.old <- -1e10
    for(i.iter in 1:max.iter) {
      if((i.iter%%50) == 0) {
        print(paste("We have run the first ", i.iter, " iterations",sep=""))
      }
      err<-tol+1

      ## compute posterior cluster membership
      clustlike<-matrix(0,xrow,2)
      clustlike[,1]<-log(1-p[coli])+loglike0[[coli]]
      clustlike[,2]<-log(p[coli])+loglike1[[coli]]

      tempmax<-apply(clustlike,1,max)
      for(j in 1:2) {
        clustlike[,j]<-exp(clustlike[,j]-tempmax)
      }
      tempsum<-apply(clustlike,1,sum)

      ## evaluate whether the log.likelihood increases
      loglike.new<-sum(tempmax+log(tempsum))/xrow

      ## update motif occurrence rate
      for(j in 1:2) {
        clustlike[,j]<-clustlike[,j]/tempsum
      }

      p.new<-(sum(clustlike[,2]))/(xrow)

      ## evaluate convergence
      err<-abs(p.new-p[coli])/p[coli]
      loglike.old<-loglike.new
      p[coli]<-p.new

      if(err<tol) {
        break;
      }
    }

    ## compute posterior p
    clustlike<-matrix(0,xrow,2)
    clustlike[,1]<-log(1-p[coli])+loglike0[[coli]]
    clustlike[,2]<-log(p[coli])+loglike1[[coli]]

    tempmax<-apply(clustlike,1,max)
    for(j in 1:2) {
      clustlike[,j]<-exp(clustlike[,j]-tempmax)
    }
    tempsum<-apply(clustlike,1,sum)

    for(j in 1:2) {
      clustlike[,j]<-clustlike[,j]/tempsum
    }

    p.post[,coli]<-clustlike[,2]
    loglike.final[coli]<-loglike.old
  }


  ## return
  loglike.final<-loglike.final*xrow
  result<-list(p.post=p.post, motif.prior=p, loglike=loglike.final)
}

## Fit the full model
cmfitfull<-function(x, type, tol=1e-3, max.iter=100) {
  ## initialize
  xrow<-nrow(x)
  xcol<-ncol(x)
  loglike0<-list()
  loglike1<-list()
  K<-2^xcol
  p<-rep(1,K)/K
  pattern<-rep(0,xcol)
  patid<-matrix(0,K,xcol)

  ## compute loglikelihood
  for(i in 1:xcol) {
    f0<-type[[i]][[1]]
    f0param<-type[[i]][[2]]
    f1<-type[[i]][[3]]
    f1param<-type[[i]][[4]]
    loglike0[[i]]<-f0(x[,i],f0param)
    loglike1[[i]]<-f1(x[,i],f1param)
  }
  L<-matrix(0,xrow,K)
  for(i in 1:K)
  {
    patid[i,]<-pattern
    for(j in 1:xcol) {
      if(pattern[j] < 0.5) {
        L[,i]<-L[,i]+loglike0[[j]]
      } else {
        L[,i]<-L[,i]+loglike1[[j]]
      }
    }

    if(i < K) {
      pattern[xcol]<-pattern[xcol]+1
      j<-xcol
      while(pattern[j] > 1) {
        pattern[j]<-0
        j<-j-1
        pattern[j]<-pattern[j]+1
      }
    }
  }

  ## EM algorithm to get MLE of p and q
  loglike.old <- -1e10
  for(i.iter in 1:max.iter) {
    if((i.iter%%50) == 0) {
      print(paste("We have run the first ", i.iter, " iterations",sep=""))
    }
    err<-tol+1

    ## compute posterior cluster membership
    clustlike<-matrix(0,xrow,K)
    for(j in 1:K) {
      clustlike[,j]<-log(p[j])+L[,j]
    }

    tempmax<-apply(clustlike,1,max)
    for(j in 1:K) {
      clustlike[,j]<-exp(clustlike[,j]-tempmax)
    }
    tempsum<-apply(clustlike,1,sum)

    ## update motif occurrence rate
    for(j in 1:K) {
      clustlike[,j]<-clustlike[,j]/tempsum
    }

    p.new<-(apply(clustlike,2,sum)+1)/(xrow+K)

    ## evaluate convergence
    err<-max(abs(p.new-p)/p)

    ## evaluate whether the log.likelihood increases
    loglike.new<-(sum(tempmax+log(tempsum))+sum(log(p.new)))/xrow

    loglike.old<-loglike.new
    p<-p.new

    if(err<tol) {
      break;
    }
  }

  ## compute posterior p
  clustlike<-matrix(0,xrow,K)
  for(j in 1:K) {
    clustlike[,j]<-log(p[j])+L[,j]
  }

  tempmax<-apply(clustlike,1,max)
  for(j in 1:K) {
    clustlike[,j]<-exp(clustlike[,j]-tempmax)
  }
  tempsum<-apply(clustlike,1,sum)

  for(j in 1:K) {
    clustlike[,j]<-clustlike[,j]/tempsum
  }

  p.post<-matrix(0,xrow,xcol)
  for(j in 1:K) {
    for(i in 1:xcol) {
      if(patid[j,i] > 0.5) {
        p.post[,i]<-p.post[,i]+clustlike[,j]
      }
    }
  }

  ## return
  #calculate back loglikelihood
  loglike.old<-loglike.old-sum(log(p))/xrow
  loglike.old<-loglike.old*xrow
  result<-list(p.post=p.post, motif.prior=p, loglike=loglike.old)
}

generatetype<-function(limfitted)
{
  jtype<-list()
  df<-limfitted$g1num+limfitted$g2num-2+limfitted$df0
  for(j in 1:limfitted$compnum)
  {
    jtype[[j]]<-list(f0=modt.f0.loglike, f0.param=df[j], f1=modt.f1.loglike, f1.param=c(df[j],limfitted$g1num[j],limfitted$g2num[j],limfitted$v0[j]))
  }
  jtype
}

cormotiffit <- function(exprs, groupid=NULL, compid=NULL, K=1, tol=1e-3,
                        max.iter=100, BIC=TRUE, norm.factor.method="TMM",
                        voom.normalize.method = "none", runtype=c("logCPM","counts","limmafits"), each=3)
{
  # first I want to do some typechecking. Input can be either a normalized
  # matrix, a count matrix, or a list of limma fits. Dispatch the correct
  # limmafit accordingly.
  # todo: add some typechecking here
  limfitted <- list()
  if (runtype=="counts") {
    limfitted <- limmafit.counts(exprs,groupid,compid, norm.factor.method, voom.normalize.method)
  } else if (runtype=="logCPM") {
    limfitted <- limmafit.default(exprs,groupid,compid)
  } else if (runtype=="limmafits") {
    limfitted <- limmafit.list(exprs)
  } else {
    stop("runtype must be one of 'logCPM', 'counts', or 'limmafits'")
  }


  jtype<-generatetype(limfitted)
  fitresult<-list()
  ks <- rep(K, each = each)
  fitresult <- bplapply(1:length(ks), function(i, x, type, ks, tol, max.iter) {
    cmfit.X(x, type, K = ks[i], tol = tol, max.iter = max.iter)
  }, x=limfitted$t, type=jtype, ks=ks, tol=tol, max.iter=max.iter)

  best.fitresults <- list()
  for (i in 1:length(K)) {
    w.k <- which(ks==K[i])
    this.bic <- c()
    for (j in w.k) this.bic[j] <- -2 * fitresult[[j]]$loglike + (K[i] - 1 + K[i] * limfitted$compnum) * log(dim(limfitted$t)[1])
    w.min <- which(this.bic == min(this.bic, na.rm = TRUE))[1]
    best.fitresults[[i]] <- fitresult[[w.min]]
  }
  fitresult <- best.fitresults

  bic <- rep(0, length(K))
  aic <- rep(0, length(K))
  loglike <- rep(0, length(K))
  for (i in 1:length(K)) loglike[i] <- fitresult[[i]]$loglike
  for (i in 1:length(K)) bic[i] <- -2 * fitresult[[i]]$loglike + (K[i] - 1 + K[i] * limfitted$compnum) * log(dim(limfitted$t)[1])
  for (i in 1:length(K)) aic[i] <- -2 * fitresult[[i]]$loglike + 2 * (K[i] - 1 + K[i] * limfitted$compnum)
  if(BIC==TRUE) {
    bestflag=which(bic==min(bic))
  }
  else {
    bestflag=which(aic==min(aic))
  }
  result<-list(bestmotif=fitresult[[bestflag]],bic=cbind(K,bic),
               aic=cbind(K,aic),loglike=cbind(K,loglike), allmotifs=fitresult)

}

cormotiffitall<-function(exprs,groupid,compid, tol=1e-3, max.iter=100)
{
  limfitted<-limmafit(exprs,groupid,compid)
  jtype<-generatetype(limfitted)
  fitresult<-cmfitall(limfitted$t,type=jtype,tol=1e-3,max.iter=max.iter)
}

cormotiffitsep<-function(exprs,groupid,compid, tol=1e-3, max.iter=100)
{
  limfitted<-limmafit(exprs,groupid,compid)
  jtype<-generatetype(limfitted)
  fitresult<-cmfitsep(limfitted$t,type=jtype,tol=1e-3,max.iter=max.iter)
}

cormotiffitfull<-function(exprs,groupid,compid, tol=1e-3, max.iter=100)
{
  limfitted<-limmafit(exprs,groupid,compid)
  jtype<-generatetype(limfitted)
  fitresult<-cmfitfull(limfitted$t,type=jtype,tol=1e-3,max.iter=max.iter)
}

plotIC<-function(fitted_cormotif)
{
  oldpar<-par(mfrow=c(1,2))
  plot(fitted_cormotif$bic[,1], fitted_cormotif$bic[,2], type="b",xlab="Motif Number", ylab="BIC", main="BIC")
  plot(fitted_cormotif$aic[,1], fitted_cormotif$aic[,2], type="b",xlab="Motif Number", ylab="AIC", main="AIC")
}

plotMotif<-function(fitted_cormotif,title="")
{
  layout(matrix(1:2,ncol=2))
  u<-1:dim(fitted_cormotif$bestmotif$motif.q)[2]
  v<-1:dim(fitted_cormotif$bestmotif$motif.q)[1]
  image(u,v,t(fitted_cormotif$bestmotif$motif.q),
        col=gray(seq(from=1,to=0,by=-0.1)),xlab="Study",yaxt = "n",
        ylab="Corr. Motifs",main=paste(title,"pattern",sep=" "))
  axis(2,at=1:length(v))
  for(i in 1:(length(u)+1))
  {
    abline(v=(i-0.5))
  }
  for(i in 1:(length(v)+1))
  {
    abline(h=(i-0.5))
  }
  Ng=10000
  if(is.null(fitted_cormotif$bestmotif$p.post)!=TRUE)
    Ng=nrow(fitted_cormotif$bestmotif$p.post)
  genecount=floor(fitted_cormotif$bestmotif$motif.p*Ng)
  NK=nrow(fitted_cormotif$bestmotif$motif.q)
  plot(0,0.7,pch=".",xlim=c(0,1.2),ylim=c(0.75,NK+0.25),
       frame.plot=FALSE,axes=FALSE,xlab="No. of genes",ylab="", main=paste(title,"frequency",sep=" "))
  segments(0,0.7,fitted_cormotif$bestmotif$motif.p[1],0.7)
  rect(0,1:NK-0.3,fitted_cormotif$bestmotif$motif.p,1:NK+0.3,
       col="dark grey")
  mtext(1:NK,at=1:NK,side=2,cex=0.8)
  text(fitted_cormotif$bestmotif$motif.p+0.15,1:NK,
       labels=floor(fitted_cormotif$bestmotif$motif.p*Ng))
}
library(edgeR)
library(Cormotif)
library(RColorBrewer)
## read in count file##
design <- read.csv("data/data_outline.txt", row.names = 1)
mymatrix <- readRDS("data/filtermatrix_x.RDS")#should be 14084
x_counts <- mymatrix$counts
label_list <- readRDS("data/label_list.RDS")
list2env(label_list,envir = .GlobalEnv)
label <- (interaction(drug, indv, time))
colnames(x_counts) <- label
group_fac <- group1
groupid <- as.numeric(group_fac)
# saveRDS(x_counts,"output/x_counts.RDS")
compid <- data.frame(c1= c(1,2,3,4,5,7,8,9,10,11), c2 = c( 6,6,6,6,6,12,12,12,12,12))
y_TMM_cpm <- cpm(x_counts, log = TRUE)
colnames(y_TMM_cpm) <- label
y_TMM_cpm
set.seed(12345)
cormotif_initial <- cormotiffit(exprs = y_TMM_cpm,
groupid = groupid,
compid = compid,
K=1:8, max.iter = 500, runtype="logCPM")
gene_prob_tran <- cormotif_initial$bestmotif$p.post
rownames(gene_prob_tran) <- rownames(y_TMM_cpm)
motif_prob <- cormotif_initial$bestmotif$clustlike
rownames(motif_prob) <- rownames(y_TMM_cpm)
write.csv(motif_prob,"output/cormotif_probability_genelist.csv")cormotif_initial was created after calling corMotif, then running the corMotifcustom.R script. The extra R script enabled me to generate a table containing the likelihood of each gene that belongs to the specific cluster.
After generating the Motifs from 1 to 8, the number of motifs that best fit the data was 4 using the BIC and AIC results below.
cormotif_initial <- readRDS("data/cormotif_initialall.RDS")
myColors <-  rev(c("#FFFFFF", "#E6E6E6" ,"#CCCCCC", "#B3B3B3", "#999999", "#808080", "#666666","#4C4C4C", "#333333", "#191919","#000000"))


plotIC(cormotif_initial)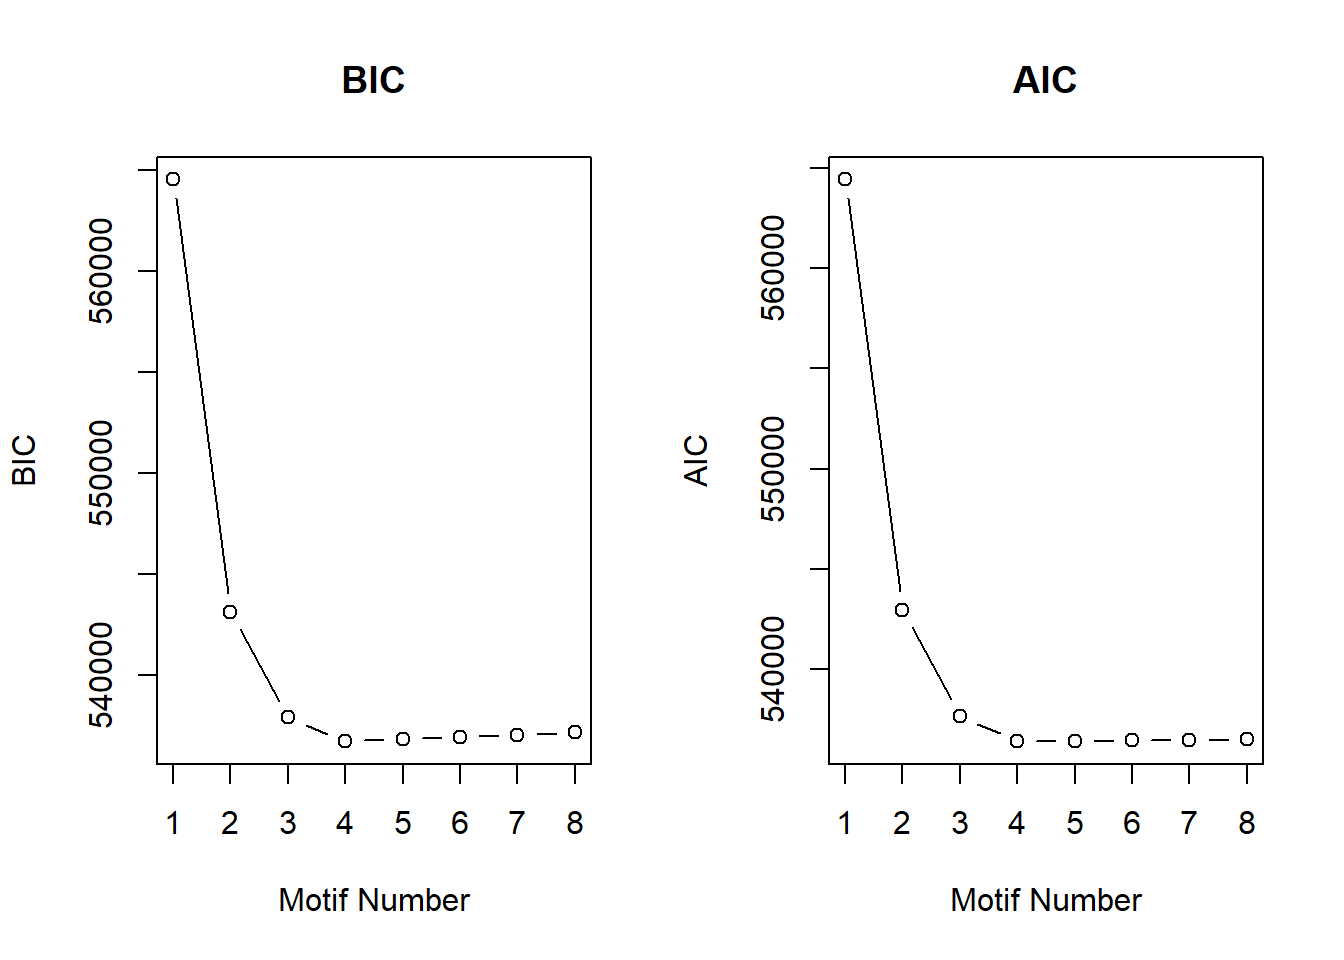
| Version | Author | Date |
|---|---|---|
| d0f459b | reneeisnowhere | 2023-04-18 |
plotMotif(cormotif_initial)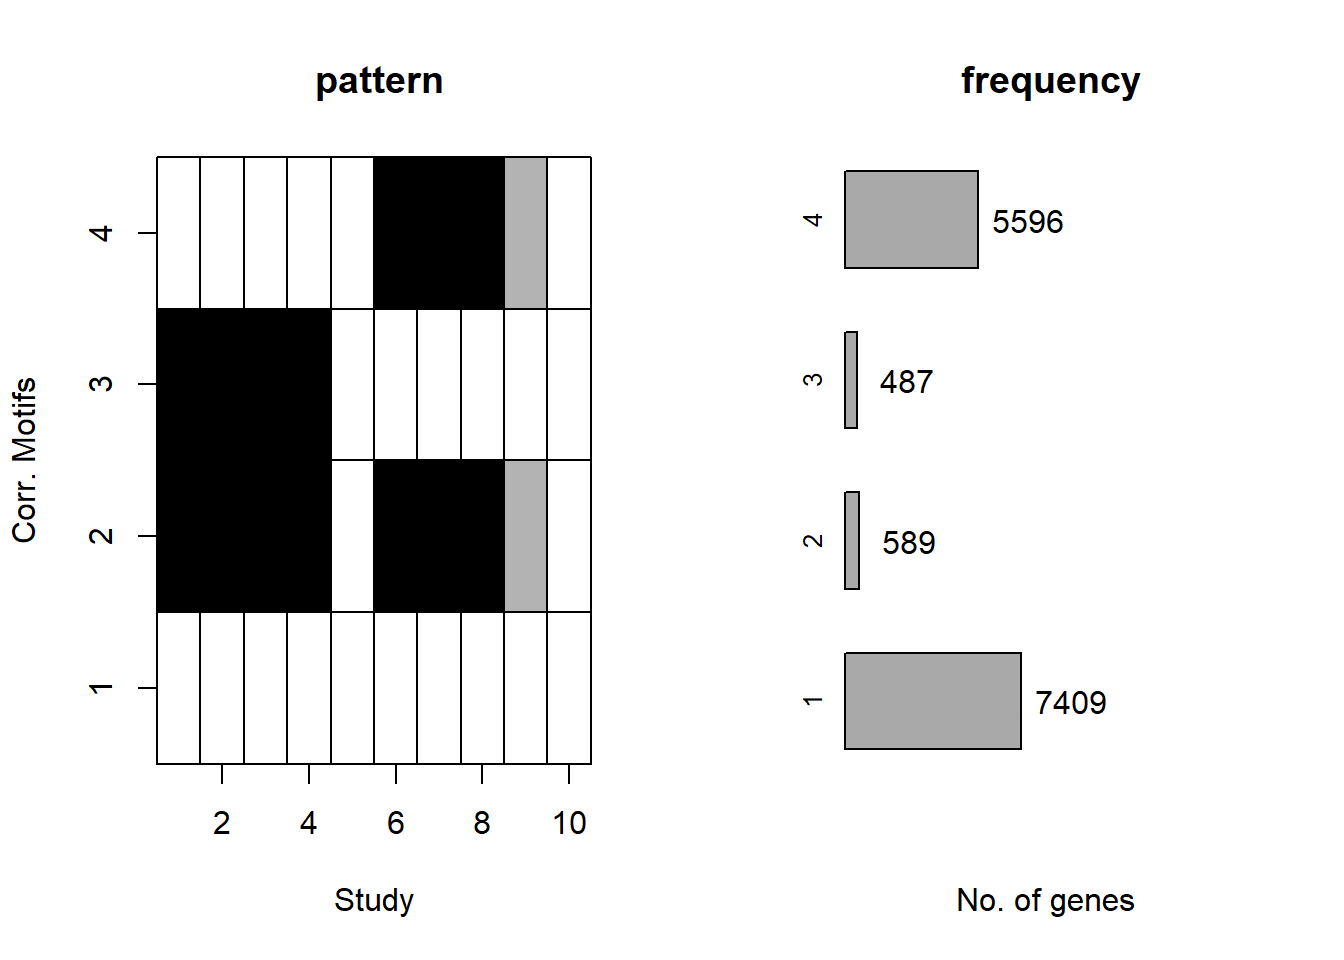
| Version | Author | Date |
|---|---|---|
| d0f459b | reneeisnowhere | 2023-04-18 |
plot.new()
legend('bottomleft',fill=myColors, legend =rev(c("0", "0.1", "0.2", "0.3", "0.4",  "0.5", "0.6", "0.7", "0.8","0.9", "1")), box.col="white",title = "Probability\nlegend", horiz=FALSE,title.cex=.8)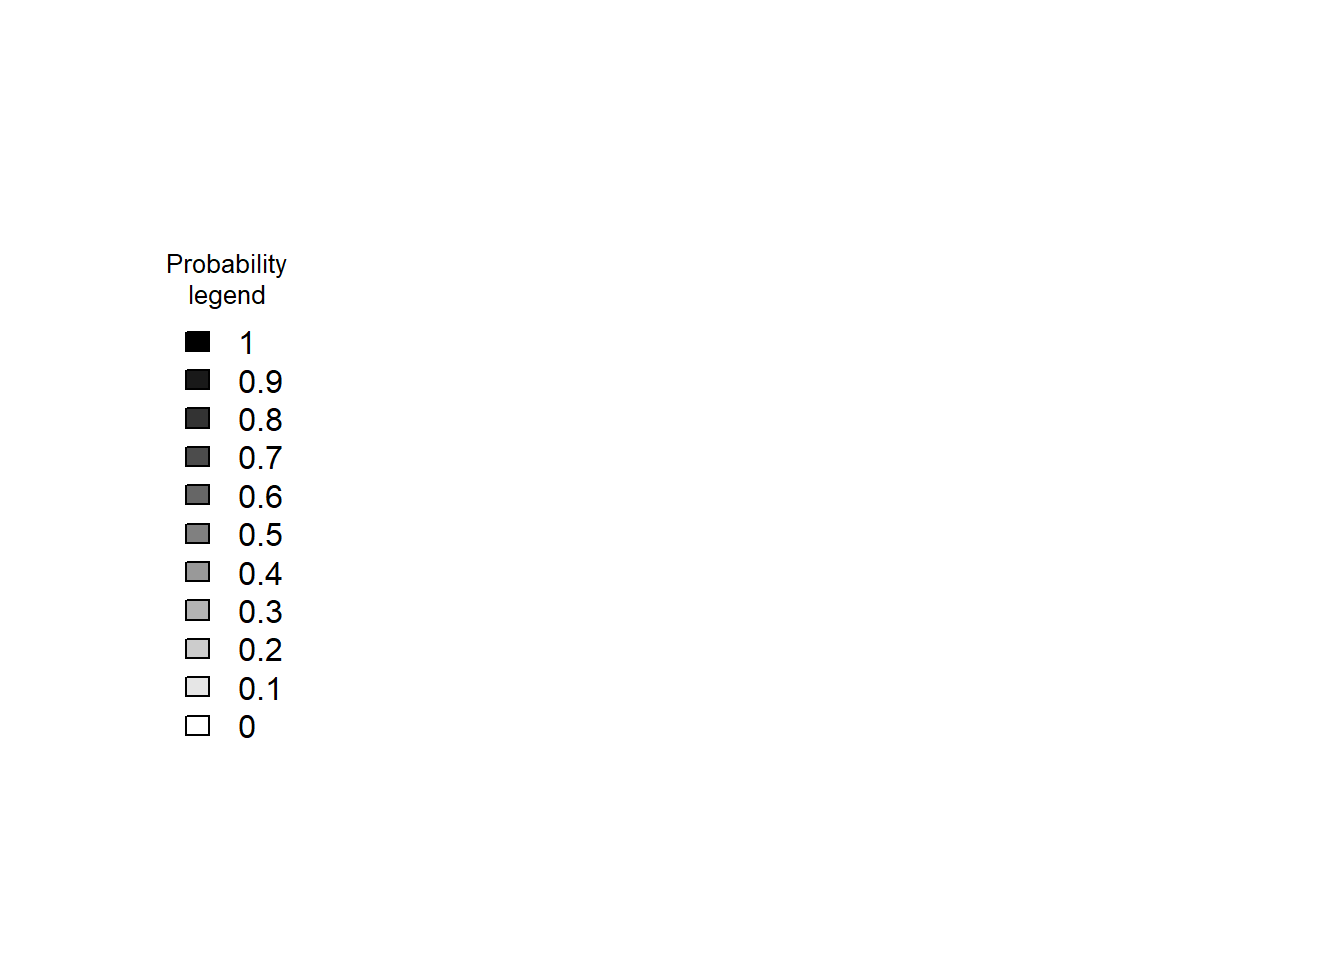
| Version | Author | Date |
|---|---|---|
| d5076c9 | reneeisnowhere | 2023-06-21 |
Viewing the motifs, the following groups were named:
Motif 1: No Response (n = 7409)
Motif 2: Top2 inhibitor response, Time-independent
- (Time-independent response, n = 589)
Motif 3: Top2 inhibitor response, Early
- (Early response, n = 487)
Motif 4: Top2 inhibitor response, Late
- (Late response, n = 5596)
motif_prob <- cormotif_initial$bestmotif$clustlike
clust1 <- motif_prob %>%
  as.data.frame() %>%
  filter(V1>0.5) %>%
  rownames
clust2 <- motif_prob %>%
  as.data.frame() %>%
  filter(V2>0.5) %>%
  rownames
clust3 <- motif_prob %>%
  as.data.frame() %>%
  filter(V3>0.5) %>%
  rownames
clust4 <- motif_prob %>%
  as.data.frame() %>%
  filter(V4>0.5) %>%
  rownames

backGL <- read.csv("data/backGL.txt")  ##14084
length(setdiff(backGL$ENTREZID,(union(clust1,union(clust2,union(clust3,clust4))))))
[1] 10571##63 genes not used overall same as (14084-7504-528-444-5545)Pie Chart of overall numbers
##label computation
pie_chartdata <- pie_chartdata %>%
   mutate(prop = gene_num / sum(pie_chartdata$gene_num) *100) %>%
  mutate(ypos = (prop)+ 0.5*prop )


pie_chartdata %>%
  ggplot(.,aes(x="",y=gene_num, fill=Set))+
  geom_col(width =1) +
  coord_polar("y", pi/2)+
  theme_void()+
  ggtitle("Distribution of genes for each set")+
  geom_text(aes(label = paste0(Set," (",gene_num,")")),
                position = position_stack(vjust =.45)) +
  theme(legend.position="none") +
  theme(plot.title = element_text(size = rel(1.5), hjust = 0.5))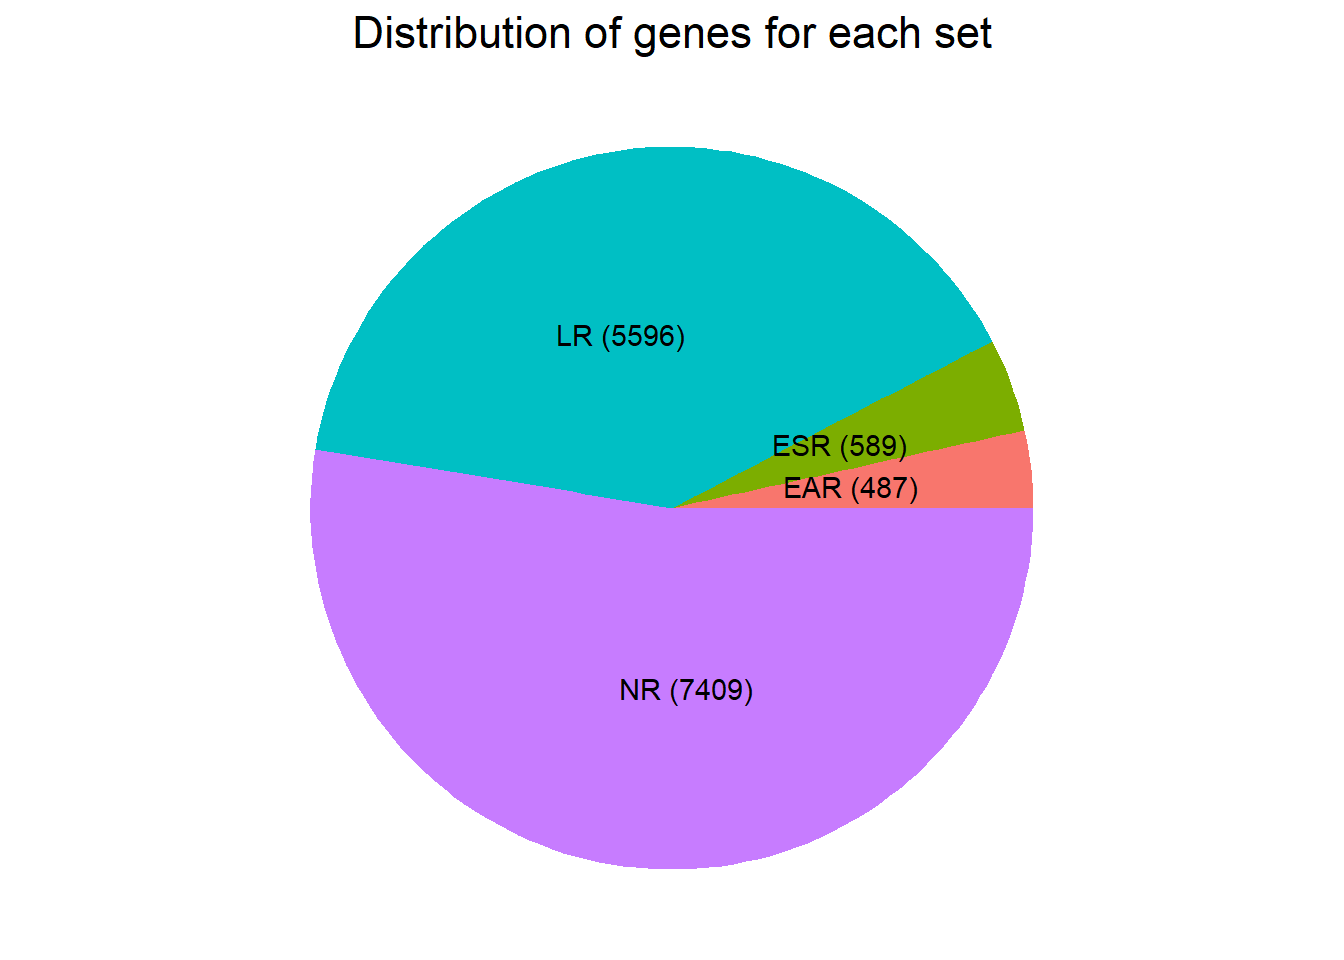
| Version | Author | Date |
|---|---|---|
| 3511b8e | reneeisnowhere | 2023-09-25 |
The genes belonging to each set were identified by the following:
motif 1- No Response set: 7504 (gene list made by filtering likelihood of gene belonging to cluster 1 >0.5)
motif 2- Time-independent Top2i response cluster: 528 (gene list made by filtering likelihood of gene belonging to cluster 2 >0.5)
motif 3- Early Top2i response cluster: 444 (gene list made by filtering likelihood of gene belonging to cluster 3 >0.5)
motif 4- Late Top2i response cluster: 5545 (gene list made by filtering likelihood of gene belonging to cluster 4 >0.5)
There was overlap between the previous sets and the new sets, so I moved on expecting similar responses in the GO analysis. I did subset out the genes not used overall from the background gene list (rowmeans>0 from log(cpm(count matrix))) ## GO and KEGG of each set
DEG_cormotif <- readRDS("data/DEG_cormotif.RDS")
list2env(DEG_cormotif, envir=.GlobalEnv)
<environment: R_GlobalEnv>label_list <- readRDS("data/label_list.RDS")
list2env(label_list, envir=.GlobalEnv)<environment: R_GlobalEnv>label <- (interaction(drug, indv, time))
backGL <- read.csv("data/backGL.txt")
#NRresp <- read_csv("data/cormotif_NRset.txt")No response motif genes
# gostrescoNR <- gost(query = motif_NR ,
#                      organism = "hsapiens",
#                        ordered_query = FALSE,
#                        domain_scope = "custom",
#                        measure_underrepresentation = FALSE,
#                        evcodes = FALSE,
#                        user_threshold = 0.05,
#                        correction_method = c("fdr"),
#                        custom_bg = backGL$ENTREZID,
#                        sources=c("GO:BP", "KEGG"))

# saveRDS(gostrescoNR, "data/gostrescoNR.")
gostrescoNR <- readRDS("data/gostrescoNR")
cormotifNRcluster <- gostplot(gostrescoNR, capped = FALSE, interactive = TRUE)
cormotifNRcluster
# (gostres$result$p_value)
tableNR <- gostrescoNR$result %>%
dplyr::select(c(source, term_id, term_name,intersection_size, term_size, p_value))
tableNR%>%
mutate_at(.cols = 6, .funs= scales::label_scientific(digits=4)) %>%
kable(.,) %>%
kable_paper("striped", full_width = FALSE) %>%
kable_styling(full_width = FALSE, position = "left",bootstrap_options = c("striped","hover")) %>%
scroll_box(width = "100%", height = "400px")| source | term_id | term_name | intersection_size | term_size | p_value |
|---|---|---|---|---|---|
| GO:BP | GO:0002181 | cytoplasmic translation | 117 | 156 | 1.507e-05 |
| GO:BP | GO:0042773 | ATP synthesis coupled electron transport | 68 | 82 | 1.507e-05 |
| GO:BP | GO:0042775 | mitochondrial ATP synthesis coupled electron transport | 68 | 82 | 1.507e-05 |
| GO:BP | GO:0019646 | aerobic electron transport chain | 63 | 74 | 1.507e-05 |
| GO:BP | GO:0009060 | aerobic respiration | 125 | 168 | 1.507e-05 |
| GO:BP | GO:0006119 | oxidative phosphorylation | 96 | 122 | 1.507e-05 |
| GO:BP | GO:0022904 | respiratory electron transport chain | 83 | 104 | 1.507e-05 |
| GO:BP | GO:0045333 | cellular respiration | 150 | 211 | 4.426e-05 |
| GO:BP | GO:1901566 | organonitrogen compound biosynthetic process | 872 | 1484 | 4.539e-04 |
| GO:BP | GO:0009100 | glycoprotein metabolic process | 209 | 316 | 7.784e-04 |
| GO:BP | GO:0006518 | peptide metabolic process | 469 | 771 | 1.771e-03 |
| GO:BP | GO:0043603 | amide metabolic process | 593 | 993 | 2.042e-03 |
| GO:BP | GO:0022900 | electron transport chain | 102 | 142 | 2.042e-03 |
| GO:BP | GO:0006412 | translation | 396 | 646 | 2.783e-03 |
| GO:BP | GO:0006486 | protein glycosylation | 129 | 187 | 2.783e-03 |
| GO:BP | GO:0043413 | macromolecule glycosylation | 129 | 187 | 2.783e-03 |
| GO:BP | GO:0070085 | glycosylation | 138 | 202 | 2.783e-03 |
| GO:BP | GO:0033108 | mitochondrial respiratory chain complex assembly | 71 | 94 | 2.799e-03 |
| GO:BP | GO:0015980 | energy derivation by oxidation of organic compounds | 189 | 288 | 3.008e-03 |
| GO:BP | GO:1901564 | organonitrogen compound metabolic process | 2733 | 4955 | 3.325e-03 |
| GO:BP | GO:0022613 | ribonucleoprotein complex biogenesis | 283 | 453 | 6.889e-03 |
| GO:BP | GO:0043043 | peptide biosynthetic process | 403 | 666 | 9.904e-03 |
| GO:BP | GO:0043604 | amide biosynthetic process | 464 | 775 | 1.033e-02 |
| GO:BP | GO:0019538 | protein metabolic process | 2342 | 4241 | 1.532e-02 |
| GO:BP | GO:0015986 | proton motive force-driven ATP synthesis | 51 | 66 | 1.576e-02 |
| GO:BP | GO:0009101 | glycoprotein biosynthetic process | 164 | 252 | 1.831e-02 |
| GO:BP | GO:0006487 | protein N-linked glycosylation | 50 | 65 | 2.164e-02 |
| GO:BP | GO:0006754 | ATP biosynthetic process | 64 | 87 | 2.244e-02 |
| GO:BP | GO:0010257 | NADH dehydrogenase complex assembly | 43 | 55 | 3.368e-02 |
| GO:BP | GO:0032981 | mitochondrial respiratory chain complex I assembly | 43 | 55 | 3.368e-02 |
| GO:BP | GO:0006091 | generation of precursor metabolites and energy | 230 | 369 | 3.697e-02 |
| GO:BP | GO:0042776 | proton motive force-driven mitochondrial ATP synthesis | 44 | 57 | 4.441e-02 |
| GO:BP | GO:0046034 | ATP metabolic process | 81 | 116 | 4.441e-02 |
| GO:BP | GO:0042254 | ribosome biogenesis | 190 | 301 | 4.978e-02 |
| KEGG | KEGG:05171 | Coronavirus disease - COVID-19 | 122 | 162 | 7.225e-07 |
| KEGG | KEGG:03010 | Ribosome | 98 | 127 | 1.551e-06 |
| KEGG | KEGG:05208 | Chemical carcinogenesis - reactive oxygen species | 133 | 186 | 1.136e-05 |
| KEGG | KEGG:04510 | Focal adhesion | 127 | 177 | 1.198e-05 |
| KEGG | KEGG:00190 | Oxidative phosphorylation | 81 | 106 | 2.532e-05 |
| KEGG | KEGG:05012 | Parkinson disease | 153 | 226 | 1.368e-04 |
| KEGG | KEGG:04512 | ECM-receptor interaction | 55 | 69 | 1.368e-04 |
| KEGG | KEGG:04714 | Thermogenesis | 134 | 195 | 1.395e-04 |
| KEGG | KEGG:05020 | Prion disease | 148 | 220 | 2.532e-04 |
| KEGG | KEGG:05415 | Diabetic cardiomyopathy | 117 | 169 | 2.653e-04 |
| KEGG | KEGG:04141 | Protein processing in endoplasmic reticulum | 110 | 161 | 1.020e-03 |
| KEGG | KEGG:00531 | Glycosaminoglycan degradation | 16 | 16 | 1.020e-03 |
| KEGG | KEGG:05016 | Huntington disease | 165 | 256 | 2.083e-03 |
| KEGG | KEGG:05010 | Alzheimer disease | 197 | 315 | 5.425e-03 |
| KEGG | KEGG:00513 | Various types of N-glycan biosynthesis | 29 | 36 | 1.088e-02 |
| KEGG | KEGG:04932 | Non-alcoholic fatty liver disease | 88 | 131 | 1.088e-02 |
| KEGG | KEGG:04142 | Lysosome | 80 | 118 | 1.175e-02 |
| KEGG | KEGG:00510 | N-Glycan biosynthesis | 36 | 48 | 2.410e-02 |
| KEGG | KEGG:04810 | Regulation of actin cytoskeleton | 114 | 179 | 3.226e-02 |
| KEGG | KEGG:01200 | Carbon metabolism | 66 | 98 | 3.806e-02 |
| KEGG | KEGG:03040 | Spliceosome | 86 | 132 | 3.945e-02 |
| KEGG | KEGG:05022 | Pathways of neurodegeneration - multiple diseases | 230 | 385 | 4.301e-02 |
  write.csv(tableNR,"output/tableNR.csv")
##GO:BP
  tableNR %>% dplyr::filter(source=="GO:BP") %>%
    dplyr::select(p_value,term_name,intersection_size) %>%
    slice_min(., n=10 ,order_by=p_value) %>%
    mutate(log_val = -log10(p_value)) %>%
   # slice_max(., n=10,order_by = p_value) %>%
   ggplot(., aes(x = log_val, y =reorder(term_name,p_value),col=intersection_size)) +
    geom_point(aes(size = intersection_size)) +
    ggtitle('No response enriched GO:BP terms') +
   xlab(expression("-log"[10]~"(p-value)"))+
    guides(col="none", size=guide_legend(title = "# of intersected \n terms"))+
    ylab("GO: BP term")+
    scale_y_discrete(labels = scales::label_wrap(30))+
      theme_bw()+
    theme(plot.title = element_text(size = rel(1.5), hjust = 0.5),
        axis.title = element_text(size = 15, color = "black"),
        axis.ticks = element_line(linewidth = 1.5),
        axis.line = element_line(linewidth = 1.5),
        axis.text = element_text(size = 10, color = "black", angle = 0),
        strip.text.x = element_text(size = 15, color = "black", face = "bold"))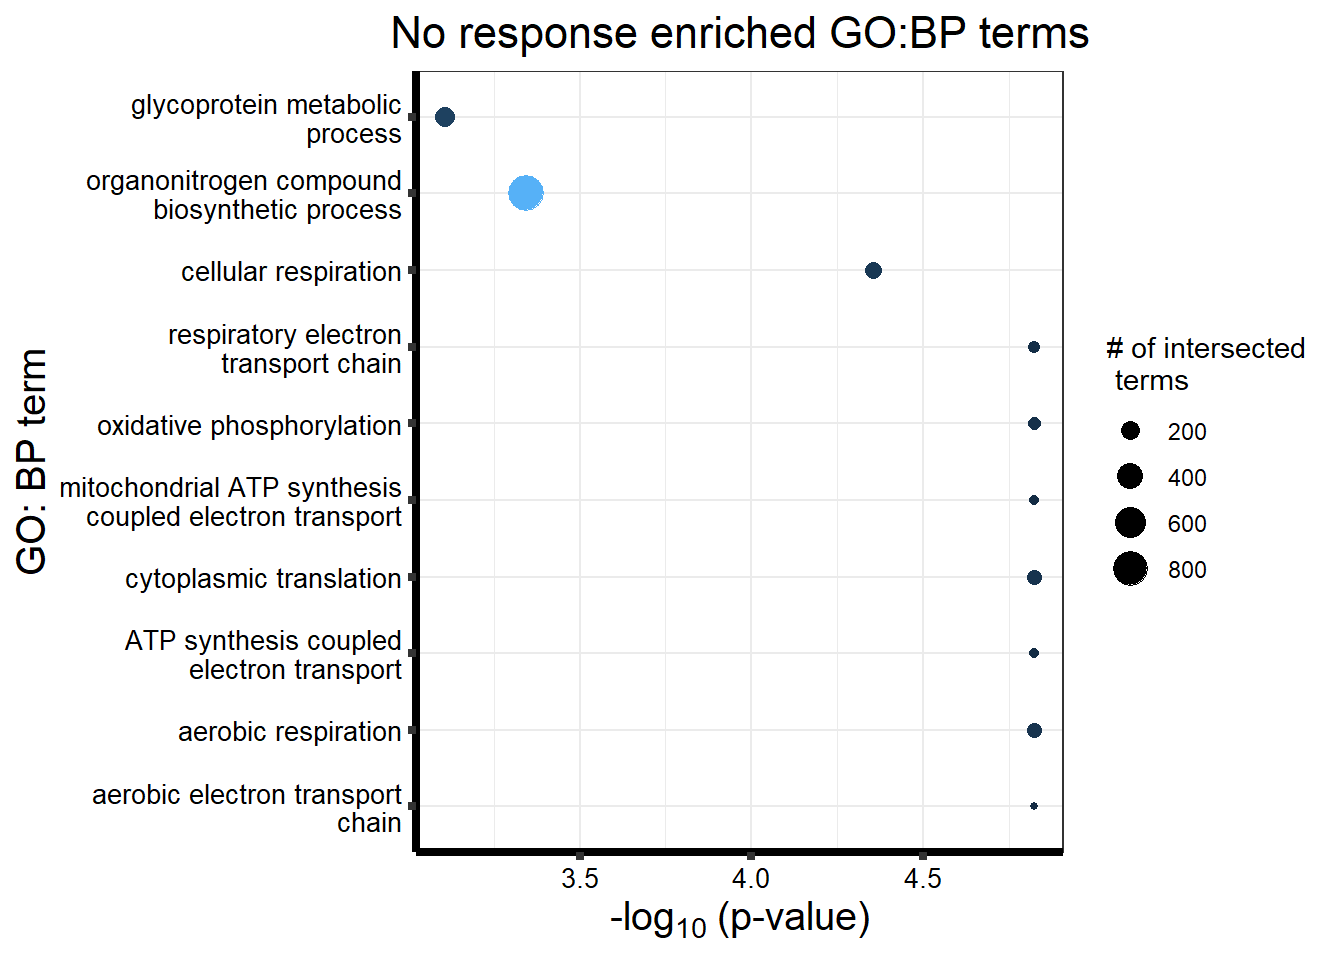
##kegg

  tableNR %>%
    dplyr::filter(source!="GO:BP") %>%
    dplyr::select(p_value,term_name,intersection_size) %>%
    slice_min(., n=15 ,order_by=p_value) %>%
    mutate(log_val = -log10(p_value)) %>%
   # slice_max(., n=10,order_by = p_value) %>%
   ggplot(., aes(x = log_val,
                 y =reorder(term_name,p_value),
                 col=intersection_size)) +
    geom_point(aes(size = intersection_size, col="red")) +
    ggtitle('No response enriched KEGG terms') +
    scale_y_discrete(labels = scales::label_wrap(30))+
    guides(col="none", size=guide_legend(title = "# of intersected \n terms"))+
    xlab(expression("-log"[10]~"(p-value)"))+
    ylab("KEGG term")+
      theme_bw()+
    theme(plot.title = element_text(size = rel(1.5), hjust = 0.5),
        axis.title = element_text(size = 15, color = "black"),
        axis.ticks = element_line(linewidth = 1.5),
        axis.line = element_line(linewidth = 1.5),
        axis.text = element_text(size = 10, color = "black", angle = 0),
        strip.text.x = element_text(size = 15, color = "black", face = "bold"))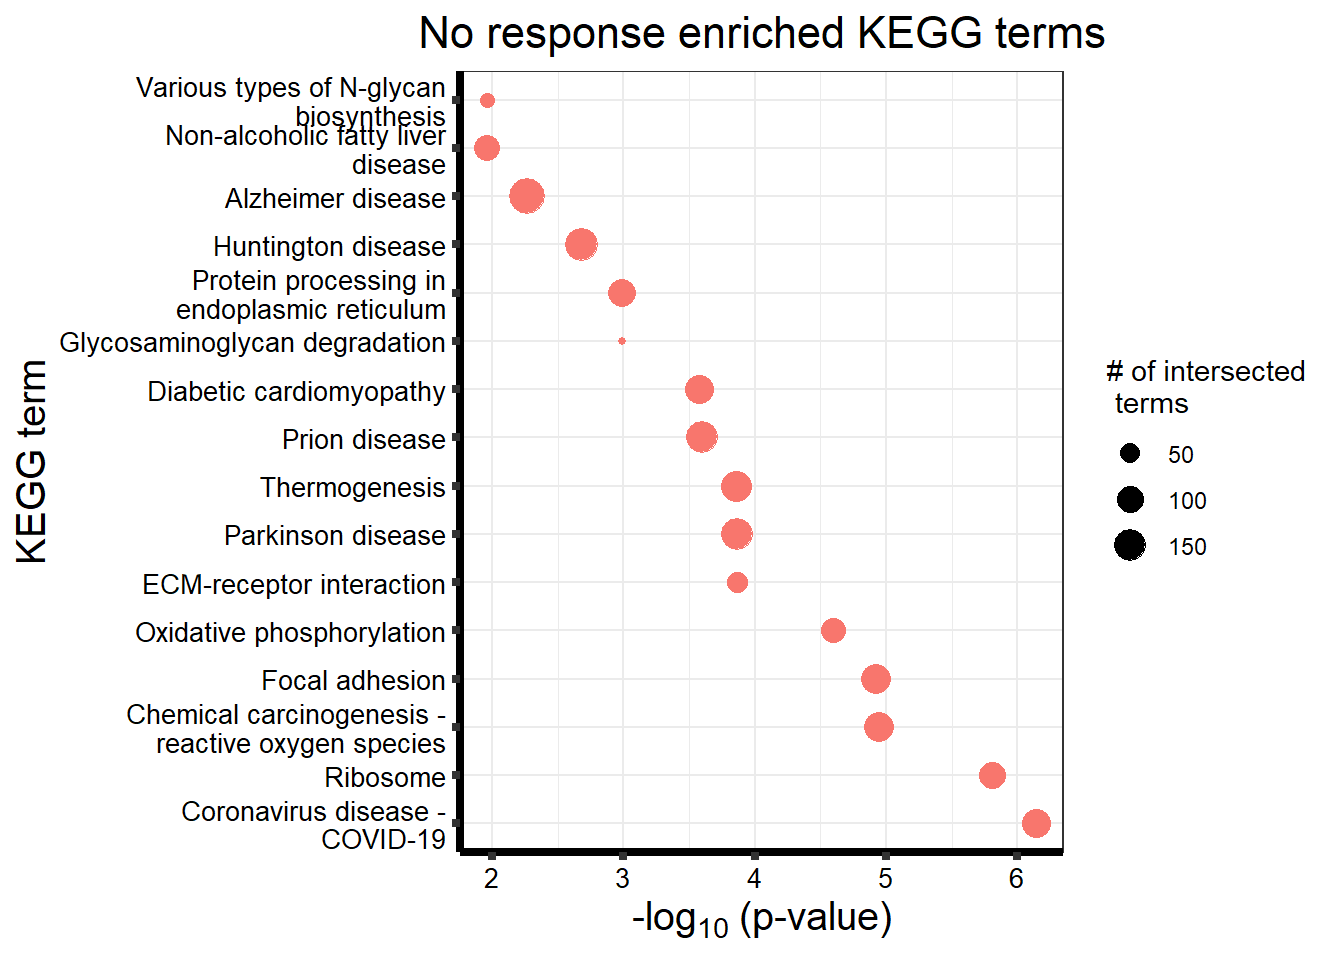
Late response Top2\(\beta\) inhibitor motif genes
# gostresTop2bi_LR <- gost(query = c(motif_LR),
#                       organism = "hsapiens",
#                       ordered_query = FALSE,
#                       domain_scope = "custom",
#                       measure_underrepresentation = FALSE,
#                       evcodes = FALSE,
#                       user_threshold = 0.05,
#                       correction_method = c("fdr"),
#                       custom_bg = backGL$ENTREZID,
#                       sources=c("GO:BP", "KEGG"))
# saveRDS(gostresTop2bi_LR,"data/gostresTop2bi_LR.RDS")
gostresTop2bi_LR <- readRDS("data/gostresTop2bi_LR.RDS")
cormotifrespTop2bi_LR <- gostplot(gostresTop2bi_LR, capped = FALSE, interactive = TRUE)
cormotifrespTop2bi_LR
tabletop2Bi_LR <- gostresTop2bi_LR$result %>%
dplyr::select(c(source, term_id, term_name,intersection_size, term_size, p_value))
tabletop2Bi_LR%>%
mutate_at(.cols = 6, .funs= scales::label_scientific(digits=4)) %>%
kable(.,) %>%
kable_paper("striped", full_width = FALSE) %>%
kable_styling(full_width = FALSE, position = "left",bootstrap_options = c("striped","hover")) %>%
scroll_box(width = "100%", height = "400px")| source | term_id | term_name | intersection_size | term_size | p_value |
|---|---|---|---|---|---|
| GO:BP | GO:0007059 | chromosome segregation | 200 | 369 | 2.598e-05 |
| GO:BP | GO:0000280 | nuclear division | 185 | 344 | 1.136e-04 |
| GO:BP | GO:0051301 | cell division | 286 | 570 | 1.287e-04 |
| GO:BP | GO:0007049 | cell cycle | 694 | 1529 | 2.325e-04 |
| GO:BP | GO:0006261 | DNA-templated DNA replication | 89 | 148 | 4.174e-04 |
| GO:BP | GO:0022402 | cell cycle process | 502 | 1086 | 6.439e-04 |
| GO:BP | GO:0098813 | nuclear chromosome segregation | 147 | 273 | 6.439e-04 |
| GO:BP | GO:0061982 | meiosis I cell cycle process | 54 | 81 | 6.439e-04 |
| GO:BP | GO:0007051 | spindle organization | 107 | 188 | 6.439e-04 |
| GO:BP | GO:0140014 | mitotic nuclear division | 137 | 251 | 6.439e-04 |
| GO:BP | GO:0048285 | organelle fission | 198 | 388 | 9.885e-04 |
| GO:BP | GO:0000070 | mitotic sister chromatid segregation | 102 | 179 | 9.885e-04 |
| GO:BP | GO:0007127 | meiosis I | 51 | 77 | 1.225e-03 |
| GO:BP | GO:0000278 | mitotic cell cycle | 387 | 827 | 2.041e-03 |
| GO:BP | GO:1903047 | mitotic cell cycle process | 329 | 694 | 2.774e-03 |
| GO:BP | GO:0006260 | DNA replication | 135 | 255 | 3.497e-03 |
| GO:BP | GO:0045132 | meiotic chromosome segregation | 43 | 64 | 3.592e-03 |
| GO:BP | GO:0140013 | meiotic nuclear division | 71 | 120 | 4.267e-03 |
| GO:BP | GO:0000226 | microtubule cytoskeleton organization | 266 | 552 | 4.267e-03 |
| GO:BP | GO:1903046 | meiotic cell cycle process | 78 | 135 | 5.053e-03 |
| GO:BP | GO:0007017 | microtubule-based process | 353 | 760 | 8.645e-03 |
| GO:BP | GO:2001251 | negative regulation of chromosome organization | 55 | 90 | 1.077e-02 |
| GO:BP | GO:0000819 | sister chromatid segregation | 115 | 217 | 1.132e-02 |
| GO:BP | GO:0045930 | negative regulation of mitotic cell cycle | 112 | 211 | 1.259e-02 |
| GO:BP | GO:0051716 | cellular response to stimulus | 2050 | 4953 | 1.303e-02 |
| GO:BP | GO:0032465 | regulation of cytokinesis | 49 | 79 | 1.380e-02 |
| GO:BP | GO:0070925 | organelle assembly | 375 | 817 | 1.380e-02 |
| GO:BP | GO:0051276 | chromosome organization | 258 | 543 | 1.380e-02 |
| GO:BP | GO:0008654 | phospholipid biosynthetic process | 122 | 234 | 1.380e-02 |
| GO:BP | GO:0045839 | negative regulation of mitotic nuclear division | 36 | 54 | 1.546e-02 |
| GO:BP | GO:0046474 | glycerophospholipid biosynthetic process | 101 | 189 | 1.675e-02 |
| GO:BP | GO:1902850 | microtubule cytoskeleton organization involved in mitosis | 86 | 157 | 1.761e-02 |
| GO:BP | GO:0050896 | response to stimulus | 2369 | 5770 | 1.761e-02 |
| GO:BP | GO:0045017 | glycerolipid biosynthetic process | 114 | 218 | 1.777e-02 |
| GO:BP | GO:0033046 | negative regulation of sister chromatid segregation | 32 | 47 | 1.794e-02 |
| GO:BP | GO:0033048 | negative regulation of mitotic sister chromatid segregation | 32 | 47 | 1.794e-02 |
| GO:BP | GO:2000816 | negative regulation of mitotic sister chromatid separation | 32 | 47 | 1.794e-02 |
| GO:BP | GO:0019692 | deoxyribose phosphate metabolic process | 26 | 36 | 1.798e-02 |
| GO:BP | GO:0009262 | deoxyribonucleotide metabolic process | 26 | 36 | 1.798e-02 |
| GO:BP | GO:0007093 | mitotic cell cycle checkpoint signaling | 77 | 139 | 2.123e-02 |
| GO:BP | GO:0051784 | negative regulation of nuclear division | 37 | 57 | 2.123e-02 |
| GO:BP | GO:0071173 | spindle assembly checkpoint signaling | 30 | 44 | 2.444e-02 |
| GO:BP | GO:0071174 | mitotic spindle checkpoint signaling | 30 | 44 | 2.444e-02 |
| GO:BP | GO:0007094 | mitotic spindle assembly checkpoint signaling | 30 | 44 | 2.444e-02 |
| GO:BP | GO:0000075 | cell cycle checkpoint signaling | 97 | 183 | 2.444e-02 |
| GO:BP | GO:0045841 | negative regulation of mitotic metaphase/anaphase transition | 31 | 46 | 2.546e-02 |
| GO:BP | GO:1905819 | negative regulation of chromosome separation | 32 | 48 | 2.570e-02 |
| GO:BP | GO:0051985 | negative regulation of chromosome segregation | 32 | 48 | 2.570e-02 |
| GO:BP | GO:0045786 | negative regulation of cell cycle | 166 | 338 | 2.570e-02 |
| GO:BP | GO:0006270 | DNA replication initiation | 25 | 35 | 2.570e-02 |
| GO:BP | GO:0009394 | 2’-deoxyribonucleotide metabolic process | 25 | 35 | 2.570e-02 |
| GO:BP | GO:0033047 | regulation of mitotic sister chromatid segregation | 34 | 52 | 2.637e-02 |
| GO:BP | GO:0051304 | chromosome separation | 46 | 76 | 2.918e-02 |
| GO:BP | GO:0006996 | organelle organization | 1261 | 3000 | 3.028e-02 |
| GO:BP | GO:0071417 | cellular response to organonitrogen compound | 229 | 485 | 3.122e-02 |
| GO:BP | GO:0031577 | spindle checkpoint signaling | 30 | 45 | 3.655e-02 |
| GO:BP | GO:0021537 | telencephalon development | 104 | 201 | 3.660e-02 |
| GO:BP | GO:1902100 | negative regulation of metaphase/anaphase transition of cell cycle | 31 | 47 | 3.660e-02 |
| GO:BP | GO:0007052 | mitotic spindle organization | 71 | 129 | 3.660e-02 |
| GO:BP | GO:0045143 | homologous chromosome segregation | 24 | 34 | 4.009e-02 |
| GO:BP | GO:0090407 | organophosphate biosynthetic process | 237 | 506 | 4.009e-02 |
| GO:BP | GO:1905818 | regulation of chromosome separation | 43 | 71 | 4.021e-02 |
| GO:BP | GO:1901653 | cellular response to peptide | 142 | 287 | 4.048e-02 |
| GO:BP | GO:0051256 | mitotic spindle midzone assembly | 9 | 9 | 4.080e-02 |
| GO:BP | GO:0010889 | regulation of sequestering of triglyceride | 11 | 12 | 4.632e-02 |
| GO:BP | GO:0051255 | spindle midzone assembly | 11 | 12 | 4.632e-02 |
| GO:BP | GO:1901699 | cellular response to nitrogen compound | 241 | 517 | 4.632e-02 |
| GO:BP | GO:0010564 | regulation of cell cycle process | 287 | 626 | 4.989e-02 |
| KEGG | KEGG:03030 | DNA replication | 25 | 35 | 2.693e-02 |
| KEGG | KEGG:00230 | Purine metabolism | 56 | 97 | 2.693e-02 |
 write.csv(tabletop2Bi_LR,"output/tabletop2Bi_LR.csv")

  tabletop2Bi_LR %>% dplyr::filter(source=="GO:BP") %>%
    dplyr::select(p_value,term_name,intersection_size) %>%
    slice_min(., n=10 ,order_by=p_value) %>%
    mutate(log_val = -log10(p_value)) %>%
   # slice_max(., n=10,order_by = p_value) %>%
   ggplot(., aes(x = log_val, y =reorder(term_name,log_val), col= intersection_size)) +
    geom_point(aes(size = intersection_size)) +
    scale_y_discrete(labels = scales::label_wrap(30))+
    guides(col="none", size=guide_legend(title = "# of intersected \n terms"))+
    ggtitle('Late response enriched GO:BP terms') +
    xlab(expression("-log"[10]~"(p-value)"))+
    ylab("GO: BP term")+
      theme_bw()+
    theme(plot.title = element_text(size = rel(1.5), hjust = 0.5),
        axis.title = element_text(size = 15, color = "black"),
        axis.ticks = element_line(linewidth = 1.5),
        axis.line = element_line(linewidth = 1.5),
        axis.text = element_text(size = 10, color = "black", angle = 0),
        strip.text.x = element_text(size = 15, color = "black", face = "bold"))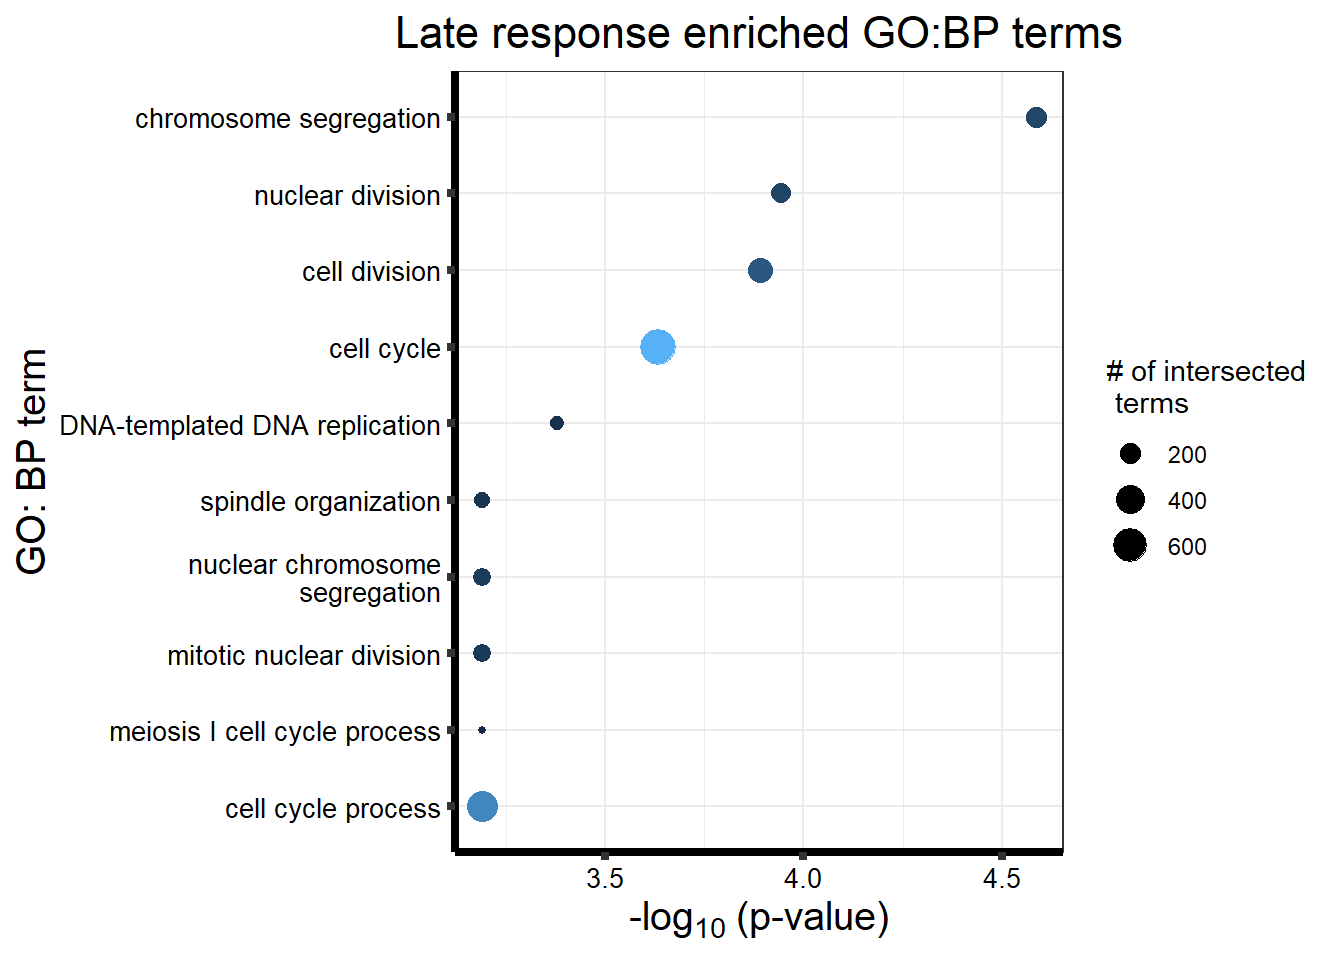
 tabletop2Bi_LR %>%
    dplyr::filter(source!="GO:BP") %>%
    dplyr::select(p_value,term_name,intersection_size) %>%
    slice_min(., n=20 ,order_by=p_value) %>%
    mutate(log_val = -log10(p_value)) %>%
   # slice_max(., n=10,order_by = p_value) %>%
   ggplot(., aes(x = log_val, y =reorder(term_name,p_value),col=intersection_size)) +
    geom_point(aes(size = intersection_size, col="red")) +
   scale_y_discrete(labels = scales::label_wrap(30))+
    guides(col="none", size=guide_legend(title = "# of intersected \n terms"))+
    ggtitle('Late response enriched KEGG terms') +
   xlab(expression("-log"[10]~"(p-value)"))+
    ylab("KEGG term")+
      theme_bw()+
 theme(plot.title = element_text(size = rel(1.5), hjust = 0.5),
        axis.title = element_text(size = 15, color = "black"),
        axis.ticks = element_line(linewidth = 1.5),
        axis.line = element_line(linewidth = 1.5),
        axis.text = element_text(size = 10, color = "black", angle = 0),
        strip.text.x = element_text(size = 15, color = "black", face = "bold"))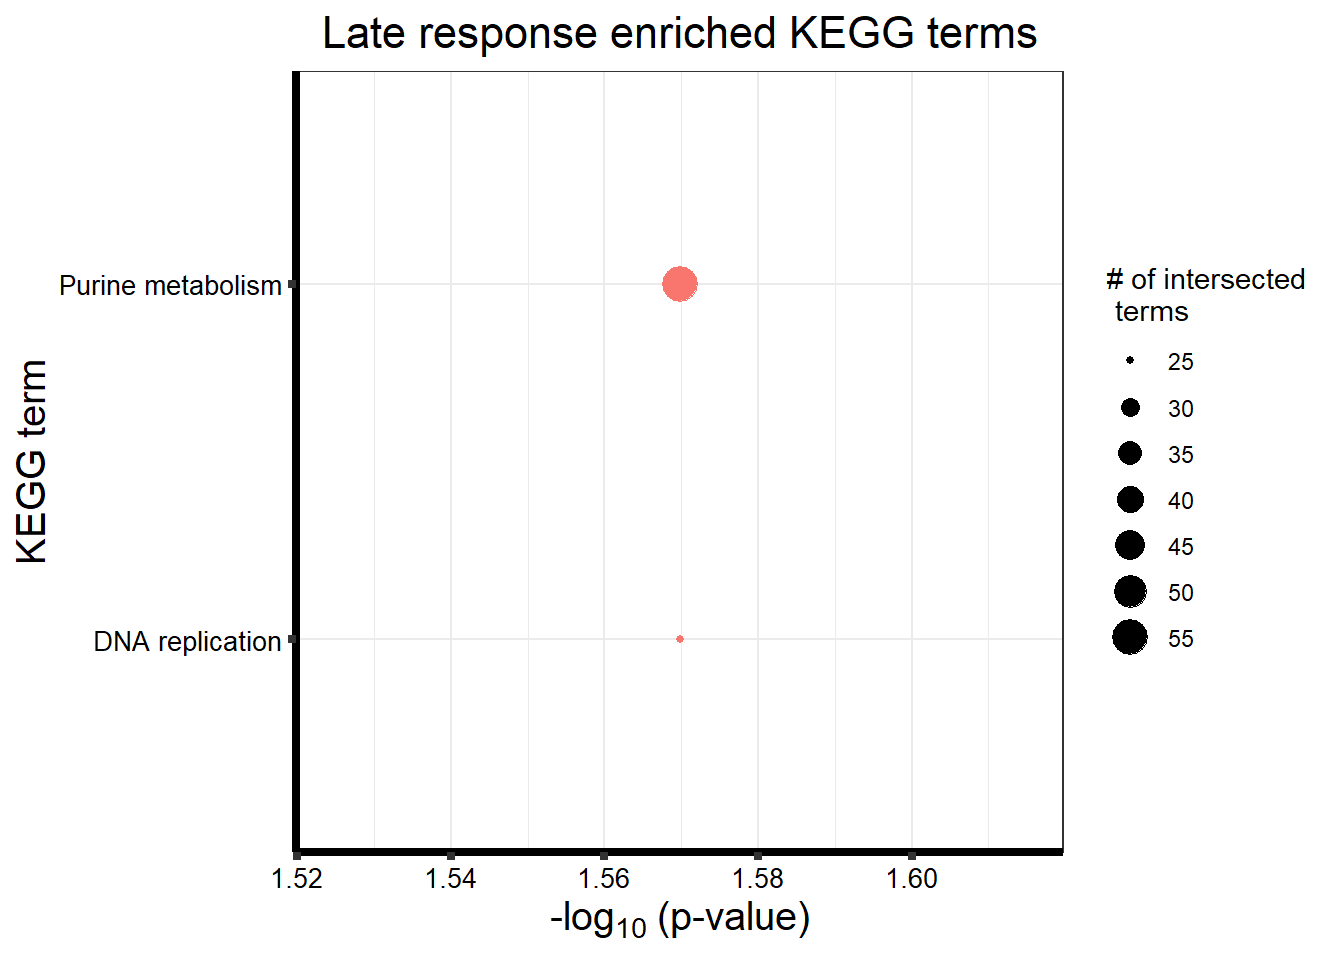
Early Response Top2 inhibitor motif genes
# gostresTop2bi_ER <- gost(query = c(motif_ER),
#                       organism = "hsapiens",
#                       ordered_query = FALSE,
#                       domain_scope = "custom",
#                       measure_underrepresentation = FALSE,
#                       evcodes = FALSE,
#                       user_threshold = 0.05,
#                       correction_method = c("fdr"),
#                       custom_bg = backGL$ENTREZID,
#                       sources=c("GO:BP", "KEGG"))
# saveRDS(gostresTop2bi_ER, "data/gostresTop2bi_ER.RDS")

gostresTop2bi_ER <- readRDS("data/gostresTop2bi_ER.RDS")
cormotifrespTop2bi_ER <- gostplot(gostresTop2bi_ER, capped = FALSE, interactive = TRUE)

gostresTop2bi_ER$result %>%
  mutate_at(.cols = 6, .funs= scales::label_scientific(digits=4)) %>%
  kable(.,) %>%
  kable_paper("striped", full_width = FALSE) %>%
  kable_styling(full_width = FALSE, position = "left",bootstrap_options = c("striped","hover")) %>%
scroll_box(width = "100%", height = "400px")| query | significant | p_value | term_size | query_size | intersection_size | precision | recall | term_id | source | term_name | effective_domain_size | source_order | parents |
|---|---|---|---|---|---|---|---|---|---|---|---|---|---|
| query_1 | TRUE | 0.0000000 | 2684 | 428 | 2.16e+02 | 0.5046729 | 0.0804769 | GO:0097659 | GO:BP | nucleic acid-templated transcription | 13586 | 19768 | GO:00104…. |
| query_1 | TRUE | 0.0000000 | 2683 | 428 | 2.16e+02 | 0.5046729 | 0.0805069 | GO:0006351 | GO:BP | DNA-templated transcription | 13586 | 2176 | GO:0097659 |
| query_1 | TRUE | 0.0000000 | 2714 | 428 | 2.16e+02 | 0.5046729 | 0.0795873 | GO:0032774 | GO:BP | RNA biosynthetic process | 13586 | 8240 | GO:00090…. |
| query_1 | TRUE | 0.0000000 | 1995 | 428 | 1.83e+02 | 0.4275701 | 0.0917293 | GO:0006366 | GO:BP | transcription by RNA polymerase II | 13586 | 2189 | GO:0006351 |
| query_1 | TRUE | 0.0000000 | 2576 | 428 | 2.09e+02 | 0.4883178 | 0.0811335 | GO:1903506 | GO:BP | regulation of nucleic acid-templated transcription | 13586 | 24157 | GO:00976…. |
| query_1 | TRUE | 0.0000000 | 2574 | 428 | 2.09e+02 | 0.4883178 | 0.0811966 | GO:0006355 | GO:BP | regulation of DNA-templated transcription | 13586 | 2180 | GO:00063…. |
| query_1 | TRUE | 0.0000000 | 1914 | 428 | 1.78e+02 | 0.4158879 | 0.0929990 | GO:0006357 | GO:BP | regulation of transcription by RNA polymerase II | 13586 | 2182 | GO:00063…. |
| query_1 | TRUE | 0.0000000 | 3080 | 428 | 2.30e+02 | 0.5373832 | 0.0746753 | GO:0019219 | GO:BP | regulation of nucleobase-containing compound metabolic process | 13586 | 5897 | GO:00061…. |
| query_1 | TRUE | 0.0000000 | 2593 | 428 | 2.09e+02 | 0.4883178 | 0.0806016 | GO:2001141 | GO:BP | regulation of RNA biosynthetic process | 13586 | 27647 | GO:00105…. |
| query_1 | TRUE | 0.0000000 | 2845 | 428 | 2.19e+02 | 0.5116822 | 0.0769772 | GO:0051252 | GO:BP | regulation of RNA metabolic process | 13586 | 14368 | GO:00160…. |
| query_1 | TRUE | 0.0000000 | 4048 | 428 | 2.59e+02 | 0.6051402 | 0.0639822 | GO:0090304 | GO:BP | nucleic acid metabolic process | 13586 | 19208 | GO:00061…. |
| query_1 | TRUE | 0.0000000 | 3012 | 428 | 2.19e+02 | 0.5116822 | 0.0727092 | GO:0010556 | GO:BP | regulation of macromolecule biosynthetic process | 13586 | 4304 | GO:00090…. |
| query_1 | TRUE | 0.0000000 | 4174 | 428 | 2.63e+02 | 0.6144860 | 0.0630091 | GO:0031323 | GO:BP | regulation of cellular metabolic process | 13586 | 7510 | GO:00192…. |
| query_1 | TRUE | 0.0000000 | 3600 | 428 | 2.41e+02 | 0.5630841 | 0.0669444 | GO:0016070 | GO:BP | RNA metabolic process | 13586 | 5221 | GO:0090304 |
| query_1 | TRUE | 0.0000000 | 3070 | 428 | 2.19e+02 | 0.5116822 | 0.0713355 | GO:0034654 | GO:BP | nucleobase-containing compound biosynthetic process | 13586 | 9171 | GO:00061…. |
| query_1 | TRUE | 0.0000000 | 3080 | 428 | 2.19e+02 | 0.5116822 | 0.0711039 | GO:0031326 | GO:BP | regulation of cellular biosynthetic process | 13586 | 7513 | GO:00098…. |
| query_1 | TRUE | 0.0000000 | 3133 | 428 | 2.20e+02 | 0.5140187 | 0.0702202 | GO:0019438 | GO:BP | aromatic compound biosynthetic process | 13586 | 6097 | GO:00067…. |
| query_1 | TRUE | 0.0000000 | 3132 | 428 | 2.20e+02 | 0.5140187 | 0.0702427 | GO:0018130 | GO:BP | heterocycle biosynthetic process | 13586 | 5504 | GO:00442…. |
| query_1 | TRUE | 0.0000000 | 3169 | 428 | 2.20e+02 | 0.5140187 | 0.0694225 | GO:0009889 | GO:BP | regulation of biosynthetic process | 13586 | 3827 | GO:00090…. |
| query_1 | TRUE | 0.0000000 | 3237 | 428 | 2.21e+02 | 0.5163551 | 0.0682731 | GO:1901362 | GO:BP | organic cyclic compound biosynthetic process | 13586 | 22388 | GO:19013…. |
| query_1 | TRUE | 0.0000000 | 4292 | 428 | 2.60e+02 | 0.6074766 | 0.0605778 | GO:0051171 | GO:BP | regulation of nitrogen compound metabolic process | 13586 | 14316 | GO:00068…. |
| query_1 | TRUE | 0.0000000 | 4417 | 428 | 2.64e+02 | 0.6168224 | 0.0597691 | GO:0080090 | GO:BP | regulation of primary metabolic process | 13586 | 18790 | GO:00192…. |
| query_1 | TRUE | 0.0000000 | 3580 | 428 | 2.33e+02 | 0.5443925 | 0.0650838 | GO:0010468 | GO:BP | regulation of gene expression | 13586 | 4251 | GO:00104…. |
| query_1 | TRUE | 0.0000000 | 3730 | 428 | 2.36e+02 | 0.5514019 | 0.0632708 | GO:0009059 | GO:BP | macromolecule biosynthetic process | 13586 | 3311 | GO:00431…. |
| query_1 | TRUE | 0.0000000 | 4455 | 428 | 2.62e+02 | 0.6121495 | 0.0588103 | GO:0006139 | GO:BP | nucleobase-containing compound metabolic process | 13586 | 2028 | GO:00067…. |
| query_1 | TRUE | 0.0000000 | 4617 | 428 | 2.66e+02 | 0.6214953 | 0.0576132 | GO:0060255 | GO:BP | regulation of macromolecule metabolic process | 13586 | 15305 | GO:00192…. |
| query_1 | TRUE | 0.0000000 | 4570 | 428 | 2.63e+02 | 0.6144860 | 0.0575492 | GO:0046483 | GO:BP | heterocycle metabolic process | 13586 | 12897 | GO:0044237 |
| query_1 | TRUE | 0.0000000 | 4596 | 428 | 2.63e+02 | 0.6144860 | 0.0572237 | GO:0006725 | GO:BP | cellular aromatic compound metabolic process | 13586 | 2484 | GO:0044237 |
| query_1 | TRUE | 0.0000000 | 3750 | 428 | 2.31e+02 | 0.5397196 | 0.0616000 | GO:0044271 | GO:BP | cellular nitrogen compound biosynthetic process | 13586 | 11584 | GO:00346…. |
| query_1 | TRUE | 0.0000000 | 4747 | 428 | 2.65e+02 | 0.6191589 | 0.0558247 | GO:1901360 | GO:BP | organic cyclic compound metabolic process | 13586 | 22386 | GO:0071704 |
| query_1 | TRUE | 0.0000000 | 5017 | 428 | 2.73e+02 | 0.6378505 | 0.0544150 | GO:0019222 | GO:BP | regulation of metabolic process | 13586 | 5900 | GO:00081…. |
| query_1 | TRUE | 0.0000000 | 4587 | 428 | 2.58e+02 | 0.6028037 | 0.0562459 | GO:0010467 | GO:BP | gene expression | 13586 | 4250 | GO:0043170 |
| query_1 | TRUE | 0.0000000 | 4245 | 428 | 2.45e+02 | 0.5724299 | 0.0577150 | GO:0044249 | GO:BP | cellular biosynthetic process | 13586 | 11577 | GO:00090…. |
| query_1 | TRUE | 0.0000000 | 4946 | 428 | 2.67e+02 | 0.6238318 | 0.0539830 | GO:0034641 | GO:BP | cellular nitrogen compound metabolic process | 13586 | 9164 | GO:00068…. |
| query_1 | TRUE | 0.0000000 | 4539 | 428 | 2.49e+02 | 0.5817757 | 0.0548579 | GO:1901576 | GO:BP | organic substance biosynthetic process | 13586 | 22571 | GO:00090…. |
| query_1 | TRUE | 0.0000000 | 4590 | 428 | 2.49e+02 | 0.5817757 | 0.0542484 | GO:0009058 | GO:BP | biosynthetic process | 13586 | 3310 | GO:0008152 |
| query_1 | TRUE | 0.0000000 | 7069 | 428 | 3.22e+02 | 0.7523364 | 0.0455510 | GO:0043170 | GO:BP | macromolecule metabolic process | 13586 | 11154 | GO:0071704 |
| query_1 | TRUE | 0.0000000 | 6996 | 428 | 3.14e+02 | 0.7336449 | 0.0448828 | GO:0044237 | GO:BP | cellular metabolic process | 13586 | 11571 | GO:00081…. |
| query_1 | TRUE | 0.0000000 | 7552 | 428 | 3.29e+02 | 0.7686916 | 0.0435646 | GO:0050794 | GO:BP | regulation of cellular process | 13586 | 14008 | GO:00099…. |
| query_1 | TRUE | 0.0000000 | 1315 | 428 | 1.05e+02 | 0.2453271 | 0.0798479 | GO:1903508 | GO:BP | positive regulation of nucleic acid-templated transcription | 13586 | 24159 | GO:00976…. |
| query_1 | TRUE | 0.0000000 | 1315 | 428 | 1.05e+02 | 0.2453271 | 0.0798479 | GO:0045893 | GO:BP | positive regulation of DNA-templated transcription | 13586 | 12393 | GO:00063…. |
| query_1 | TRUE | 0.0000000 | 1441 | 428 | 1.11e+02 | 0.2593458 | 0.0770298 | GO:0051254 | GO:BP | positive regulation of RNA metabolic process | 13586 | 14370 | GO:00106…. |
| query_1 | TRUE | 0.0000000 | 1322 | 428 | 1.05e+02 | 0.2453271 | 0.0794251 | GO:1902680 | GO:BP | positive regulation of RNA biosynthetic process | 13586 | 23482 | GO:00105…. |
| query_1 | TRUE | 0.0000000 | 1602 | 428 | 1.16e+02 | 0.2710280 | 0.0724095 | GO:0045935 | GO:BP | positive regulation of nucleobase-containing compound metabolic process | 13586 | 12431 | GO:00061…. |
| query_1 | TRUE | 0.0000000 | 7441 | 428 | 3.21e+02 | 0.7500000 | 0.0431394 | GO:0006807 | GO:BP | nitrogen compound metabolic process | 13586 | 2543 | GO:0008152 |
| query_1 | TRUE | 0.0000000 | 1015 | 428 | 8.60e+01 | 0.2009346 | 0.0847291 | GO:0045892 | GO:BP | negative regulation of DNA-templated transcription | 13586 | 12392 | GO:00063…. |
| query_1 | TRUE | 0.0000000 | 7806 | 428 | 3.29e+02 | 0.7686916 | 0.0421471 | GO:0044238 | GO:BP | primary metabolic process | 13586 | 11572 | GO:0008152 |
| query_1 | TRUE | 0.0000000 | 1017 | 428 | 8.60e+01 | 0.2009346 | 0.0845624 | GO:1903507 | GO:BP | negative regulation of nucleic acid-templated transcription | 13586 | 24158 | GO:00976…. |
| query_1 | TRUE | 0.0000000 | 1026 | 428 | 8.60e+01 | 0.2009346 | 0.0838207 | GO:1902679 | GO:BP | negative regulation of RNA biosynthetic process | 13586 | 23481 | GO:00105…. |
| query_1 | TRUE | 0.0000000 | 1507 | 428 | 1.09e+02 | 0.2546729 | 0.0723291 | GO:0010557 | GO:BP | positive regulation of macromolecule biosynthetic process | 13586 | 4305 | GO:00090…. |
| query_1 | TRUE | 0.0000000 | 8061 | 428 | 3.35e+02 | 0.7827103 | 0.0415581 | GO:0050789 | GO:BP | regulation of biological process | 13586 | 14004 | GO:00081…. |
| query_1 | TRUE | 0.0000000 | 1119 | 428 | 9.00e+01 | 0.2102804 | 0.0804290 | GO:0051253 | GO:BP | negative regulation of RNA metabolic process | 13586 | 14369 | GO:00106…. |
| query_1 | TRUE | 0.0000000 | 1209 | 428 | 9.40e+01 | 0.2196262 | 0.0777502 | GO:0045934 | GO:BP | negative regulation of nucleobase-containing compound metabolic process | 13586 | 12430 | GO:00061…. |
| query_1 | TRUE | 0.0000000 | 8320 | 428 | 3.40e+02 | 0.7943925 | 0.0408654 | GO:0065007 | GO:BP | biological regulation | 13586 | 16811 | GO:0008150 |
| query_1 | TRUE | 0.0000000 | 1564 | 428 | 1.09e+02 | 0.2546729 | 0.0696931 | GO:0031328 | GO:BP | positive regulation of cellular biosynthetic process | 13586 | 7515 | GO:00098…. |
| query_1 | TRUE | 0.0000000 | 937 | 428 | 7.90e+01 | 0.1845794 | 0.0843116 | GO:0045944 | GO:BP | positive regulation of transcription by RNA polymerase II | 13586 | 12439 | GO:00063…. |
| query_1 | TRUE | 0.0000000 | 1735 | 428 | 1.16e+02 | 0.2710280 | 0.0668588 | GO:0031324 | GO:BP | negative regulation of cellular metabolic process | 13586 | 7511 | GO:00098…. |
| query_1 | TRUE | 0.0000000 | 8169 | 428 | 3.34e+02 | 0.7803738 | 0.0408863 | GO:0071704 | GO:BP | organic substance metabolic process | 13586 | 17822 | GO:0008152 |
| query_1 | TRUE | 0.0000000 | 1604 | 428 | 1.09e+02 | 0.2546729 | 0.0679551 | GO:0009891 | GO:BP | positive regulation of biosynthetic process | 13586 | 3829 | GO:00090…. |
| query_1 | TRUE | 0.0000000 | 1214 | 428 | 9.10e+01 | 0.2126168 | 0.0749588 | GO:0010558 | GO:BP | negative regulation of macromolecule biosynthetic process | 13586 | 4306 | GO:00090…. |
| query_1 | TRUE | 0.0000000 | 1239 | 428 | 9.10e+01 | 0.2126168 | 0.0734463 | GO:0031327 | GO:BP | negative regulation of cellular biosynthetic process | 13586 | 7514 | GO:00098…. |
| query_1 | TRUE | 0.0000000 | 2412 | 428 | 1.40e+02 | 0.3271028 | 0.0580431 | GO:0051173 | GO:BP | positive regulation of nitrogen compound metabolic process | 13586 | 14318 | GO:00068…. |
| query_1 | TRUE | 0.0000000 | 740 | 428 | 6.50e+01 | 0.1518692 | 0.0878378 | GO:0000122 | GO:BP | negative regulation of transcription by RNA polymerase II | 13586 | 51 | GO:00063…. |
| query_1 | TRUE | 0.0000000 | 1280 | 428 | 9.10e+01 | 0.2126168 | 0.0710938 | GO:0009890 | GO:BP | negative regulation of biosynthetic process | 13586 | 3828 | GO:00090…. |
| query_1 | TRUE | 0.0000000 | 2646 | 428 | 1.47e+02 | 0.3434579 | 0.0555556 | GO:0010604 | GO:BP | positive regulation of macromolecule metabolic process | 13586 | 4347 | GO:00098…. |
| query_1 | TRUE | 0.0000000 | 2270 | 428 | 1.31e+02 | 0.3060748 | 0.0577093 | GO:0031325 | GO:BP | positive regulation of cellular metabolic process | 13586 | 7512 | GO:00098…. |
| query_1 | TRUE | 0.0000000 | 8518 | 428 | 3.36e+02 | 0.7850467 | 0.0394459 | GO:0008152 | GO:BP | metabolic process | 13586 | 3197 | GO:0008150 |
| query_1 | TRUE | 0.0000000 | 2293 | 428 | 1.29e+02 | 0.3014019 | 0.0562582 | GO:0009892 | GO:BP | negative regulation of metabolic process | 13586 | 3830 | GO:00081…. |
| query_1 | TRUE | 0.0000000 | 1849 | 428 | 1.11e+02 | 0.2593458 | 0.0600324 | GO:0051172 | GO:BP | negative regulation of nitrogen compound metabolic process | 13586 | 14317 | GO:00068…. |
| query_1 | TRUE | 0.0000000 | 2135 | 428 | 1.22e+02 | 0.2850467 | 0.0571429 | GO:0010605 | GO:BP | negative regulation of macromolecule metabolic process | 13586 | 4348 | GO:00098…. |
| query_1 | TRUE | 0.0000000 | 2880 | 428 | 1.49e+02 | 0.3481308 | 0.0517361 | GO:0009893 | GO:BP | positive regulation of metabolic process | 13586 | 3831 | GO:00081…. |
| query_1 | TRUE | 0.0000000 | 3625 | 428 | 1.75e+02 | 0.4088785 | 0.0482759 | GO:0048523 | GO:BP | negative regulation of cellular process | 13586 | 13544 | GO:00099…. |
| query_1 | TRUE | 0.0000000 | 4045 | 428 | 1.86e+02 | 0.4345794 | 0.0459827 | GO:0048519 | GO:BP | negative regulation of biological process | 13586 | 13540 | GO:00081…. |
| query_1 | TRUE | 0.0000001 | 551 | 428 | 4.60e+01 | 0.1074766 | 0.0834846 | GO:0006325 | GO:BP | chromatin organization | 13586 | 2169 | GO:0016043 |
| query_1 | TRUE | 0.0000002 | 378 | 428 | 3.60e+01 | 0.0841121 | 0.0952381 | GO:0006338 | GO:BP | chromatin remodeling | 13586 | 2173 | GO:0006325 |
| query_1 | TRUE | 0.0000397 | 4099 | 428 | 1.76e+02 | 0.4112150 | 0.0429373 | GO:0048522 | GO:BP | positive regulation of cellular process | 13586 | 13543 | GO:00099…. |
| query_1 | TRUE | 0.0001518 | 433 | 428 | 3.30e+01 | 0.0771028 | 0.0762125 | GO:0016570 | GO:BP | histone modification | 13586 | 5382 | GO:0036211 |
| query_1 | TRUE | 0.0001867 | 4579 | 428 | 1.89e+02 | 0.4415888 | 0.0412754 | GO:0048518 | GO:BP | positive regulation of biological process | 13586 | 13539 | GO:00081…. |
| query_1 | TRUE | 0.0015558 | 1835 | 428 | 8.80e+01 | 0.2056075 | 0.0479564 | GO:0050793 | GO:BP | regulation of developmental process | 13586 | 14007 | GO:00325…. |
| query_1 | TRUE | 0.0044985 | 117 | 428 | 1.30e+01 | 0.0303738 | 0.1111111 | GO:0016571 | GO:BP | histone methylation | 13586 | 5383 | GO:00064…. |
| query_1 | TRUE | 0.0057725 | 104 | 428 | 1.20e+01 | 0.0280374 | 0.1153846 | GO:0018022 | GO:BP | peptidyl-lysine methylation | 13586 | 5461 | GO:00064…. |
| query_1 | TRUE | 0.0059120 | 89 | 428 | 1.10e+01 | 0.0257009 | 0.1235955 | GO:0034968 | GO:BP | histone lysine methylation | 13586 | 9215 | GO:00165…. |
| query_1 | TRUE | 0.0066377 | 4 | 428 | 3.00e+00 | 0.0070093 | 0.7500000 | GO:0097676 | GO:BP | histone H3-K36 dimethylation | 13586 | 19769 | GO:00104…. |
| query_1 | TRUE | 0.0077228 | 785 | 428 | 4.40e+01 | 0.1028037 | 0.0560510 | GO:0006974 | GO:BP | DNA damage response | 13586 | 2659 | GO:0033554 |
| query_1 | TRUE | 0.0088927 | 336 | 428 | 2.40e+01 | 0.0560748 | 0.0714286 | GO:0018205 | GO:BP | peptidyl-lysine modification | 13586 | 5568 | GO:0018193 |
| query_1 | TRUE | 0.0097655 | 18 | 428 | 5.00e+00 | 0.0116822 | 0.2777778 | GO:0006607 | GO:BP | NLS-bearing protein import into nucleus | 13586 | 2378 | GO:0006606 |
| query_1 | TRUE | 0.0117205 | 850 | 428 | 4.60e+01 | 0.1074766 | 0.0541176 | GO:0060429 | GO:BP | epithelium development | 13586 | 15465 | GO:0009888 |
| query_1 | TRUE | 0.0145341 | 665 | 428 | 3.80e+01 | 0.0887850 | 0.0571429 | GO:0016071 | GO:BP | mRNA metabolic process | 13586 | 5222 | GO:0016070 |
| query_1 | TRUE | 0.0146171 | 884 | 428 | 4.70e+01 | 0.1098131 | 0.0531674 | GO:0072359 | GO:BP | circulatory system development | 13586 | 18343 | GO:0048731 |
| query_1 | TRUE | 0.0149450 | 5 | 428 | 3.00e+00 | 0.0070093 | 0.6000000 | GO:0010452 | GO:BP | histone H3-K36 methylation | 13586 | 4237 | GO:0034968 |
| query_1 | TRUE | 0.0154985 | 227 | 428 | 1.80e+01 | 0.0420561 | 0.0792952 | GO:0030522 | GO:BP | intracellular receptor signaling pathway | 13586 | 7201 | GO:0007165 |
| query_1 | TRUE | 0.0168245 | 153 | 428 | 1.40e+01 | 0.0327103 | 0.0915033 | GO:0040029 | GO:BP | epigenetic regulation of gene expression | 13586 | 10481 | GO:00063…. |
| query_1 | TRUE | 0.0178521 | 11336 | 428 | 3.82e+02 | 0.8925234 | 0.0336980 | GO:0009987 | GO:BP | cellular process | 13586 | 3889 | GO:0008150 |
| query_1 | TRUE | 0.0245270 | 178 | 428 | 1.50e+01 | 0.0350467 | 0.0842697 | GO:0090596 | GO:BP | sensory organ morphogenesis | 13586 | 19390 | GO:00074…. |
| query_1 | TRUE | 0.0245270 | 1425 | 428 | 6.70e+01 | 0.1565421 | 0.0470175 | GO:0009888 | GO:BP | tissue development | 13586 | 3826 | GO:0048856 |
| query_1 | TRUE | 0.0251445 | 160 | 428 | 1.40e+01 | 0.0327103 | 0.0875000 | GO:0006479 | GO:BP | protein methylation | 13586 | 2267 | GO:00082…. |
| query_1 | TRUE | 0.0251445 | 160 | 428 | 1.40e+01 | 0.0327103 | 0.0875000 | GO:0008213 | GO:BP | protein alkylation | 13586 | 3212 | GO:0036211 |
| query_1 | TRUE | 0.0253959 | 279 | 428 | 2.00e+01 | 0.0467290 | 0.0716846 | GO:1903706 | GO:BP | regulation of hemopoiesis | 13586 | 24346 | GO:00026…. |
| query_1 | TRUE | 0.0260534 | 199 | 428 | 1.60e+01 | 0.0373832 | 0.0804020 | GO:1902105 | GO:BP | regulation of leukocyte differentiation | 13586 | 23039 | GO:00025…. |
| query_1 | TRUE | 0.0262717 | 6 | 428 | 3.00e+00 | 0.0070093 | 0.5000000 | GO:0086023 | GO:BP | adenylate cyclase-activating adrenergic receptor signaling pathway involved in heart process | 13586 | 18890 | GO:00718…. |
| query_1 | TRUE | 0.0287928 | 504 | 428 | 3.00e+01 | 0.0700935 | 0.0595238 | GO:0048729 | GO:BP | tissue morphogenesis | 13586 | 13726 | GO:00096…. |
| query_1 | TRUE | 0.0304015 | 506 | 428 | 3.00e+01 | 0.0700935 | 0.0592885 | GO:0007507 | GO:BP | heart development | 13586 | 3064 | GO:00485…. |
| query_1 | TRUE | 0.0321858 | 165 | 428 | 1.40e+01 | 0.0327103 | 0.0848485 | GO:0007623 | GO:BP | circadian rhythm | 13586 | 3152 | GO:0048511 |
| query_1 | TRUE | 0.0345089 | 534 | 428 | 3.10e+01 | 0.0724299 | 0.0580524 | GO:0043009 | GO:BP | chordate embryonic development | 13586 | 11060 | GO:0009792 |
| query_1 | TRUE | 0.0347034 | 49 | 428 | 7.00e+00 | 0.0163551 | 0.1428571 | GO:1902275 | GO:BP | regulation of chromatin organization | 13586 | 23191 | GO:00063…. |
| query_1 | TRUE | 0.0369747 | 149 | 428 | 1.30e+01 | 0.0303738 | 0.0872483 | GO:0019827 | GO:BP | stem cell population maintenance | 13586 | 6381 | GO:00325…. |
| query_1 | TRUE | 0.0408860 | 7 | 428 | 3.00e+00 | 0.0070093 | 0.4285714 | GO:1900246 | GO:BP | positive regulation of RIG-I signaling pathway | 13586 | 21445 | GO:00395…. |
| query_1 | TRUE | 0.0408860 | 151 | 428 | 1.30e+01 | 0.0303738 | 0.0860927 | GO:0098727 | GO:BP | maintenance of cell number | 13586 | 19907 | GO:0032502 |
| query_1 | TRUE | 0.0408860 | 2 | 428 | 2.00e+00 | 0.0046729 | 1.0000000 | GO:0032242 | GO:BP | regulation of nucleoside transport | 13586 | 7848 | GO:00158…. |
| query_1 | TRUE | 0.0408860 | 2 | 428 | 2.00e+00 | 0.0046729 | 1.0000000 | GO:1901898 | GO:BP | negative regulation of relaxation of cardiac muscle | 13586 | 22853 | GO:00551…. |
| query_1 | TRUE | 0.0411487 | 15 | 428 | 4.00e+00 | 0.0093458 | 0.2666667 | GO:0032239 | GO:BP | regulation of nucleobase-containing compound transport | 13586 | 7845 | GO:00159…. |
| query_1 | TRUE | 0.0449089 | 38 | 428 | 6.00e+00 | 0.0140187 | 0.1578947 | GO:2001222 | GO:BP | regulation of neuron migration | 13586 | 27702 | GO:00017…. |
| query_1 | TRUE | 0.0490935 | 155 | 428 | 1.30e+01 | 0.0303738 | 0.0838710 | GO:0045165 | GO:BP | cell fate commitment | 13586 | 11997 | GO:00301…. |
| query_1 | TRUE | 0.0490935 | 118 | 428 | 1.10e+01 | 0.0257009 | 0.0932203 | GO:1903708 | GO:BP | positive regulation of hemopoiesis | 13586 | 24348 | GO:00026…. |
| query_1 | TRUE | 0.0490935 | 118 | 428 | 1.10e+01 | 0.0257009 | 0.0932203 | GO:1902107 | GO:BP | positive regulation of leukocyte differentiation | 13586 | 23041 | GO:00025…. |
| query_1 | TRUE | 0.0000000 | 415 | 428 | 4.50e+01 | 0.1051402 | 0.1084337 | KEGG:05168 | KEGG | Herpes simplex virus 1 infection | 13586 | 442 | KEGG:00000 |
tabletop2Bi_ER <- gostresTop2bi_ER$result %>%
  dplyr::select(c(source, term_id, term_name,intersection_size, term_size, p_value))


tabletop2Bi_ER %>%
  mutate_at(.cols = 6, .funs= scales::label_scientific(digits=4)) %>%
  kable(.,) %>%
  kable_paper("striped", full_width = FALSE) %>%
  kable_styling(full_width = FALSE, position = "left",bootstrap_options = c("striped","hover")) %>%
scroll_box(width = "100%", height = "400px")| source | term_id | term_name | intersection_size | term_size | p_value |
|---|---|---|---|---|---|
| GO:BP | GO:0097659 | nucleic acid-templated transcription | 216 | 2684 | 4.831e-44 |
| GO:BP | GO:0006351 | DNA-templated transcription | 216 | 2683 | 4.831e-44 |
| GO:BP | GO:0032774 | RNA biosynthetic process | 216 | 2714 | 2.189e-43 |
| GO:BP | GO:0006366 | transcription by RNA polymerase II | 183 | 1995 | 2.249e-43 |
| GO:BP | GO:1903506 | regulation of nucleic acid-templated transcription | 209 | 2576 | 4.789e-43 |
| GO:BP | GO:0006355 | regulation of DNA-templated transcription | 209 | 2574 | 4.789e-43 |
| GO:BP | GO:0006357 | regulation of transcription by RNA polymerase II | 178 | 1914 | 5.740e-43 |
| GO:BP | GO:0019219 | regulation of nucleobase-containing compound metabolic process | 230 | 3080 | 5.740e-43 |
| GO:BP | GO:2001141 | regulation of RNA biosynthetic process | 209 | 2593 | 9.534e-43 |
| GO:BP | GO:0051252 | regulation of RNA metabolic process | 219 | 2845 | 2.793e-42 |
| GO:BP | GO:0090304 | nucleic acid metabolic process | 259 | 4048 | 3.333e-38 |
| GO:BP | GO:0010556 | regulation of macromolecule biosynthetic process | 219 | 3012 | 3.797e-38 |
| GO:BP | GO:0031323 | regulation of cellular metabolic process | 263 | 4174 | 5.752e-38 |
| GO:BP | GO:0016070 | RNA metabolic process | 241 | 3600 | 1.603e-37 |
| GO:BP | GO:0034654 | nucleobase-containing compound biosynthetic process | 219 | 3070 | 7.321e-37 |
| GO:BP | GO:0031326 | regulation of cellular biosynthetic process | 219 | 3080 | 1.177e-36 |
| GO:BP | GO:0019438 | aromatic compound biosynthetic process | 220 | 3133 | 4.702e-36 |
| GO:BP | GO:0018130 | heterocycle biosynthetic process | 220 | 3132 | 4.702e-36 |
| GO:BP | GO:0009889 | regulation of biosynthetic process | 220 | 3169 | 2.937e-35 |
| GO:BP | GO:1901362 | organic cyclic compound biosynthetic process | 221 | 3237 | 2.510e-34 |
| GO:BP | GO:0051171 | regulation of nitrogen compound metabolic process | 260 | 4292 | 3.891e-34 |
| GO:BP | GO:0080090 | regulation of primary metabolic process | 264 | 4417 | 6.045e-34 |
| GO:BP | GO:0010468 | regulation of gene expression | 233 | 3580 | 1.125e-33 |
| GO:BP | GO:0009059 | macromolecule biosynthetic process | 236 | 3730 | 2.901e-32 |
| GO:BP | GO:0006139 | nucleobase-containing compound metabolic process | 262 | 4455 | 3.237e-32 |
| GO:BP | GO:0060255 | regulation of macromolecule metabolic process | 266 | 4617 | 2.141e-31 |
| GO:BP | GO:0046483 | heterocycle metabolic process | 263 | 4570 | 1.083e-30 |
| GO:BP | GO:0006725 | cellular aromatic compound metabolic process | 263 | 4596 | 3.013e-30 |
| GO:BP | GO:0044271 | cellular nitrogen compound biosynthetic process | 231 | 3750 | 2.354e-29 |
| GO:BP | GO:1901360 | organic cyclic compound metabolic process | 265 | 4747 | 1.106e-28 |
| GO:BP | GO:0019222 | regulation of metabolic process | 273 | 5017 | 3.556e-28 |
| GO:BP | GO:0010467 | gene expression | 258 | 4587 | 6.001e-28 |
| GO:BP | GO:0044249 | cellular biosynthetic process | 245 | 4245 | 1.931e-27 |
| GO:BP | GO:0034641 | cellular nitrogen compound metabolic process | 267 | 4946 | 1.932e-26 |
| GO:BP | GO:1901576 | organic substance biosynthetic process | 249 | 4539 | 1.734e-24 |
| GO:BP | GO:0009058 | biosynthetic process | 249 | 4590 | 1.070e-23 |
| GO:BP | GO:0043170 | macromolecule metabolic process | 322 | 7069 | 1.384e-21 |
| GO:BP | GO:0044237 | cellular metabolic process | 314 | 6996 | 5.668e-19 |
| GO:BP | GO:0050794 | regulation of cellular process | 329 | 7552 | 1.274e-18 |
| GO:BP | GO:1903508 | positive regulation of nucleic acid-templated transcription | 105 | 1315 | 7.760e-18 |
| GO:BP | GO:0045893 | positive regulation of DNA-templated transcription | 105 | 1315 | 7.760e-18 |
| GO:BP | GO:0051254 | positive regulation of RNA metabolic process | 111 | 1441 | 7.808e-18 |
| GO:BP | GO:1902680 | positive regulation of RNA biosynthetic process | 105 | 1322 | 1.100e-17 |
| GO:BP | GO:0045935 | positive regulation of nucleobase-containing compound metabolic process | 116 | 1602 | 1.150e-16 |
| GO:BP | GO:0006807 | nitrogen compound metabolic process | 321 | 7441 | 1.263e-16 |
| GO:BP | GO:0045892 | negative regulation of DNA-templated transcription | 86 | 1015 | 9.336e-16 |
| GO:BP | GO:0044238 | primary metabolic process | 329 | 7806 | 1.011e-15 |
| GO:BP | GO:1903507 | negative regulation of nucleic acid-templated transcription | 86 | 1017 | 1.011e-15 |
| GO:BP | GO:1902679 | negative regulation of RNA biosynthetic process | 86 | 1026 | 1.712e-15 |
| GO:BP | GO:0010557 | positive regulation of macromolecule biosynthetic process | 109 | 1507 | 1.770e-15 |
| GO:BP | GO:0050789 | regulation of biological process | 335 | 8061 | 2.536e-15 |
| GO:BP | GO:0051253 | negative regulation of RNA metabolic process | 90 | 1119 | 3.409e-15 |
| GO:BP | GO:0045934 | negative regulation of nucleobase-containing compound metabolic process | 94 | 1209 | 5.154e-15 |
| GO:BP | GO:0065007 | biological regulation | 340 | 8320 | 1.640e-14 |
| GO:BP | GO:0031328 | positive regulation of cellular biosynthetic process | 109 | 1564 | 2.373e-14 |
| GO:BP | GO:0045944 | positive regulation of transcription by RNA polymerase II | 79 | 937 | 2.887e-14 |
| GO:BP | GO:0031324 | negative regulation of cellular metabolic process | 116 | 1735 | 4.001e-14 |
| GO:BP | GO:0071704 | organic substance metabolic process | 334 | 8169 | 8.304e-14 |
| GO:BP | GO:0009891 | positive regulation of biosynthetic process | 109 | 1604 | 1.326e-13 |
| GO:BP | GO:0010558 | negative regulation of macromolecule biosynthetic process | 91 | 1214 | 1.594e-13 |
| GO:BP | GO:0031327 | negative regulation of cellular biosynthetic process | 91 | 1239 | 5.461e-13 |
| GO:BP | GO:0051173 | positive regulation of nitrogen compound metabolic process | 140 | 2412 | 1.626e-12 |
| GO:BP | GO:0000122 | negative regulation of transcription by RNA polymerase II | 65 | 740 | 2.417e-12 |
| GO:BP | GO:0009890 | negative regulation of biosynthetic process | 91 | 1280 | 3.689e-12 |
| GO:BP | GO:0010604 | positive regulation of macromolecule metabolic process | 147 | 2646 | 9.659e-12 |
| GO:BP | GO:0031325 | positive regulation of cellular metabolic process | 131 | 2270 | 2.536e-11 |
| GO:BP | GO:0008152 | metabolic process | 336 | 8518 | 4.520e-11 |
| GO:BP | GO:0009892 | negative regulation of metabolic process | 129 | 2293 | 2.638e-10 |
| GO:BP | GO:0051172 | negative regulation of nitrogen compound metabolic process | 111 | 1849 | 2.688e-10 |
| GO:BP | GO:0010605 | negative regulation of macromolecule metabolic process | 122 | 2135 | 4.514e-10 |
| GO:BP | GO:0009893 | positive regulation of metabolic process | 149 | 2880 | 1.795e-09 |
| GO:BP | GO:0048523 | negative regulation of cellular process | 175 | 3625 | 4.157e-09 |
| GO:BP | GO:0048519 | negative regulation of biological process | 186 | 4045 | 4.792e-08 |
| GO:BP | GO:0006325 | chromatin organization | 46 | 551 | 8.684e-08 |
| GO:BP | GO:0006338 | chromatin remodeling | 36 | 378 | 1.915e-07 |
| GO:BP | GO:0048522 | positive regulation of cellular process | 176 | 4099 | 3.968e-05 |
| GO:BP | GO:0016570 | histone modification | 33 | 433 | 1.518e-04 |
| GO:BP | GO:0048518 | positive regulation of biological process | 189 | 4579 | 1.867e-04 |
| GO:BP | GO:0050793 | regulation of developmental process | 88 | 1835 | 1.556e-03 |
| GO:BP | GO:0016571 | histone methylation | 13 | 117 | 4.499e-03 |
| GO:BP | GO:0018022 | peptidyl-lysine methylation | 12 | 104 | 5.773e-03 |
| GO:BP | GO:0034968 | histone lysine methylation | 11 | 89 | 5.912e-03 |
| GO:BP | GO:0097676 | histone H3-K36 dimethylation | 3 | 4 | 6.638e-03 |
| GO:BP | GO:0006974 | DNA damage response | 44 | 785 | 7.723e-03 |
| GO:BP | GO:0018205 | peptidyl-lysine modification | 24 | 336 | 8.893e-03 |
| GO:BP | GO:0006607 | NLS-bearing protein import into nucleus | 5 | 18 | 9.766e-03 |
| GO:BP | GO:0060429 | epithelium development | 46 | 850 | 1.172e-02 |
| GO:BP | GO:0016071 | mRNA metabolic process | 38 | 665 | 1.453e-02 |
| GO:BP | GO:0072359 | circulatory system development | 47 | 884 | 1.462e-02 |
| GO:BP | GO:0010452 | histone H3-K36 methylation | 3 | 5 | 1.495e-02 |
| GO:BP | GO:0030522 | intracellular receptor signaling pathway | 18 | 227 | 1.550e-02 |
| GO:BP | GO:0040029 | epigenetic regulation of gene expression | 14 | 153 | 1.682e-02 |
| GO:BP | GO:0009987 | cellular process | 382 | 11336 | 1.785e-02 |
| GO:BP | GO:0090596 | sensory organ morphogenesis | 15 | 178 | 2.453e-02 |
| GO:BP | GO:0009888 | tissue development | 67 | 1425 | 2.453e-02 |
| GO:BP | GO:0006479 | protein methylation | 14 | 160 | 2.514e-02 |
| GO:BP | GO:0008213 | protein alkylation | 14 | 160 | 2.514e-02 |
| GO:BP | GO:1903706 | regulation of hemopoiesis | 20 | 279 | 2.540e-02 |
| GO:BP | GO:1902105 | regulation of leukocyte differentiation | 16 | 199 | 2.605e-02 |
| GO:BP | GO:0086023 | adenylate cyclase-activating adrenergic receptor signaling pathway involved in heart process | 3 | 6 | 2.627e-02 |
| GO:BP | GO:0048729 | tissue morphogenesis | 30 | 504 | 2.879e-02 |
| GO:BP | GO:0007507 | heart development | 30 | 506 | 3.040e-02 |
| GO:BP | GO:0007623 | circadian rhythm | 14 | 165 | 3.219e-02 |
| GO:BP | GO:0043009 | chordate embryonic development | 31 | 534 | 3.451e-02 |
| GO:BP | GO:1902275 | regulation of chromatin organization | 7 | 49 | 3.470e-02 |
| GO:BP | GO:0019827 | stem cell population maintenance | 13 | 149 | 3.697e-02 |
| GO:BP | GO:1900246 | positive regulation of RIG-I signaling pathway | 3 | 7 | 4.089e-02 |
| GO:BP | GO:0098727 | maintenance of cell number | 13 | 151 | 4.089e-02 |
| GO:BP | GO:0032242 | regulation of nucleoside transport | 2 | 2 | 4.089e-02 |
| GO:BP | GO:1901898 | negative regulation of relaxation of cardiac muscle | 2 | 2 | 4.089e-02 |
| GO:BP | GO:0032239 | regulation of nucleobase-containing compound transport | 4 | 15 | 4.115e-02 |
| GO:BP | GO:2001222 | regulation of neuron migration | 6 | 38 | 4.491e-02 |
| GO:BP | GO:0045165 | cell fate commitment | 13 | 155 | 4.909e-02 |
| GO:BP | GO:1903708 | positive regulation of hemopoiesis | 11 | 118 | 4.909e-02 |
| GO:BP | GO:1902107 | positive regulation of leukocyte differentiation | 11 | 118 | 4.909e-02 |
| KEGG | KEGG:05168 | Herpes simplex virus 1 infection | 45 | 415 | 6.666e-11 |
  tabletop2Bi_ER %>%
    dplyr::filter(source=="GO:BP") %>%
    dplyr::select(p_value,term_name,intersection_size) %>%
    slice_min(., n=13 ,order_by=p_value) %>%
    mutate(log_val = -log10(p_value)) %>%
   # slice_max(., n=10,order_by = p_value) %>%
   ggplot(., aes(x = log_val, y =reorder(term_name,p_value),col=intersection_size)) +
    geom_point(aes(size = intersection_size)) +
    scale_y_discrete(labels = scales::label_wrap(35))+
    guides(col="none", size=guide_legend(title = "# of intersected \n terms"))+
    ggtitle('Early acute response enriched GO:BP terms') +
    xlab(expression("-log"[10]~"(p-value)"))+
    ylab("GO: BP term")+
      theme_bw()+
 theme(plot.title = element_text(size = rel(1.5), hjust = 0.5),
        axis.title = element_text(size = 15, color = "black"),
        axis.ticks = element_line(linewidth = 1.5),
        axis.line = element_line(linewidth = 1.5),
        axis.text = element_text(size = 8, color = "black", angle = 0),
        strip.text.x = element_text(size = 15, color = "black", face = "bold"))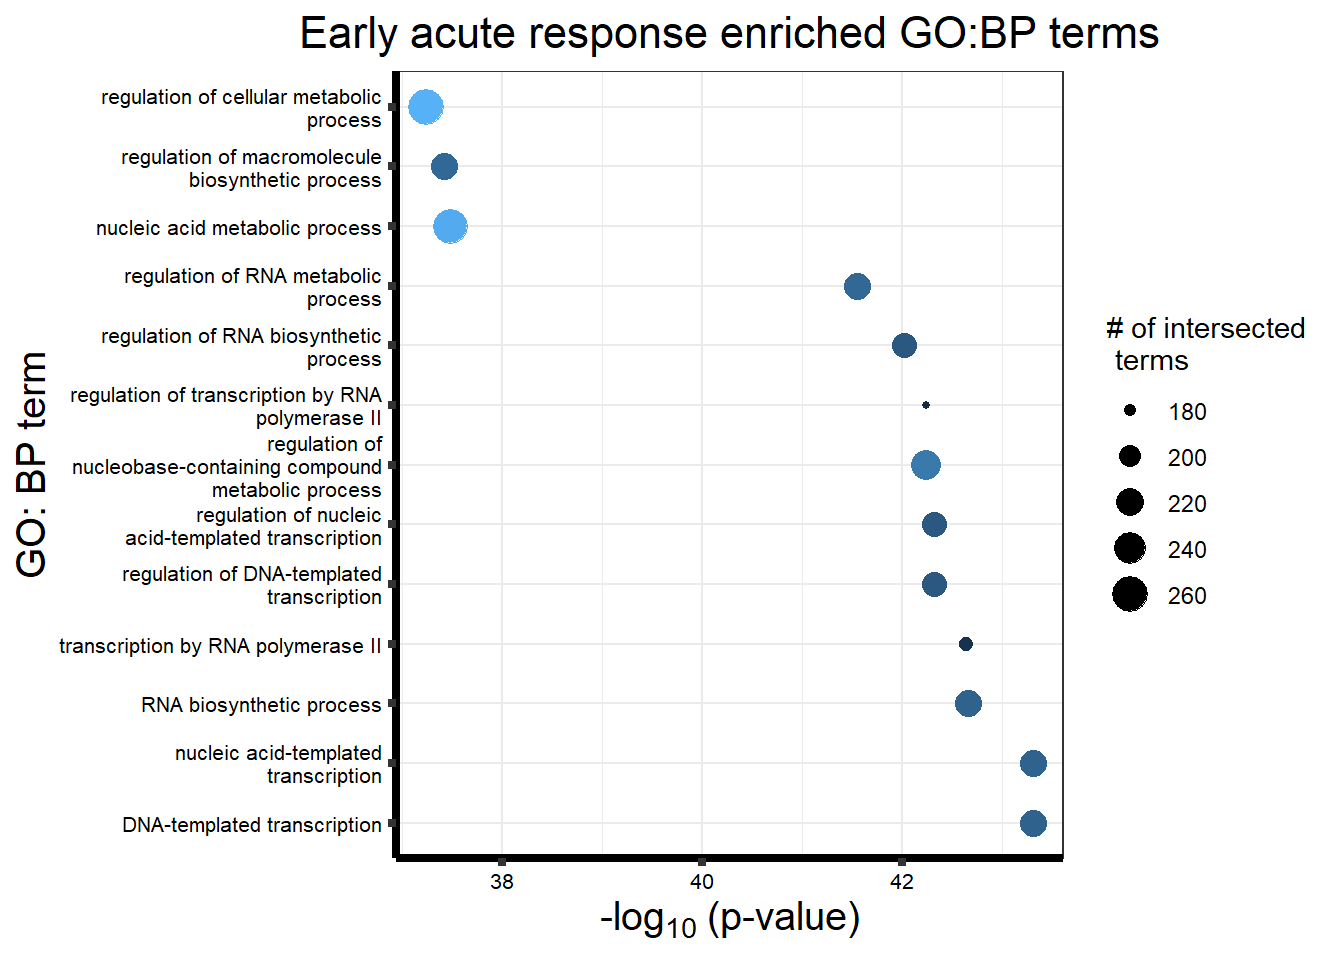
tabletop2Bi_ER %>%
    dplyr::filter(source!="GO:BP") %>%
    dplyr::select(p_value,term_name,intersection_size) %>%
    slice_min(., n=15 ,order_by=p_value) %>%
    mutate(log_val = -log10(p_value)) %>%
   ggplot(., aes(x = log_val,y = reorder(term_name,p_value),
                 col=intersection_size)) +
  geom_point(aes(size = intersection_size, col="red")) +
  scale_y_discrete(labels = scales::label_wrap(35))+
  guides(col="none",
         size=guide_legend(title ="# of intersected \n terms"))+
  ggtitle('Early acute response enriched KEGG terms') +
 xlab(expression("-log"[10]~"(p-value)"))+
  ylab("KEGG term")+
  theme_bw()+
  theme(plot.title = element_text(size = rel(1.5), hjust = 0.5),
        axis.title = element_text(size = 15, color = "black"),
        axis.ticks = element_line(linewidth = 1.5),
        axis.line = element_line(linewidth = 1.5),
        axis.text = element_text(size = 9, color = "black", angle = 0),
        strip.text.x = element_text(size = 15, color = "black", face = "bold"))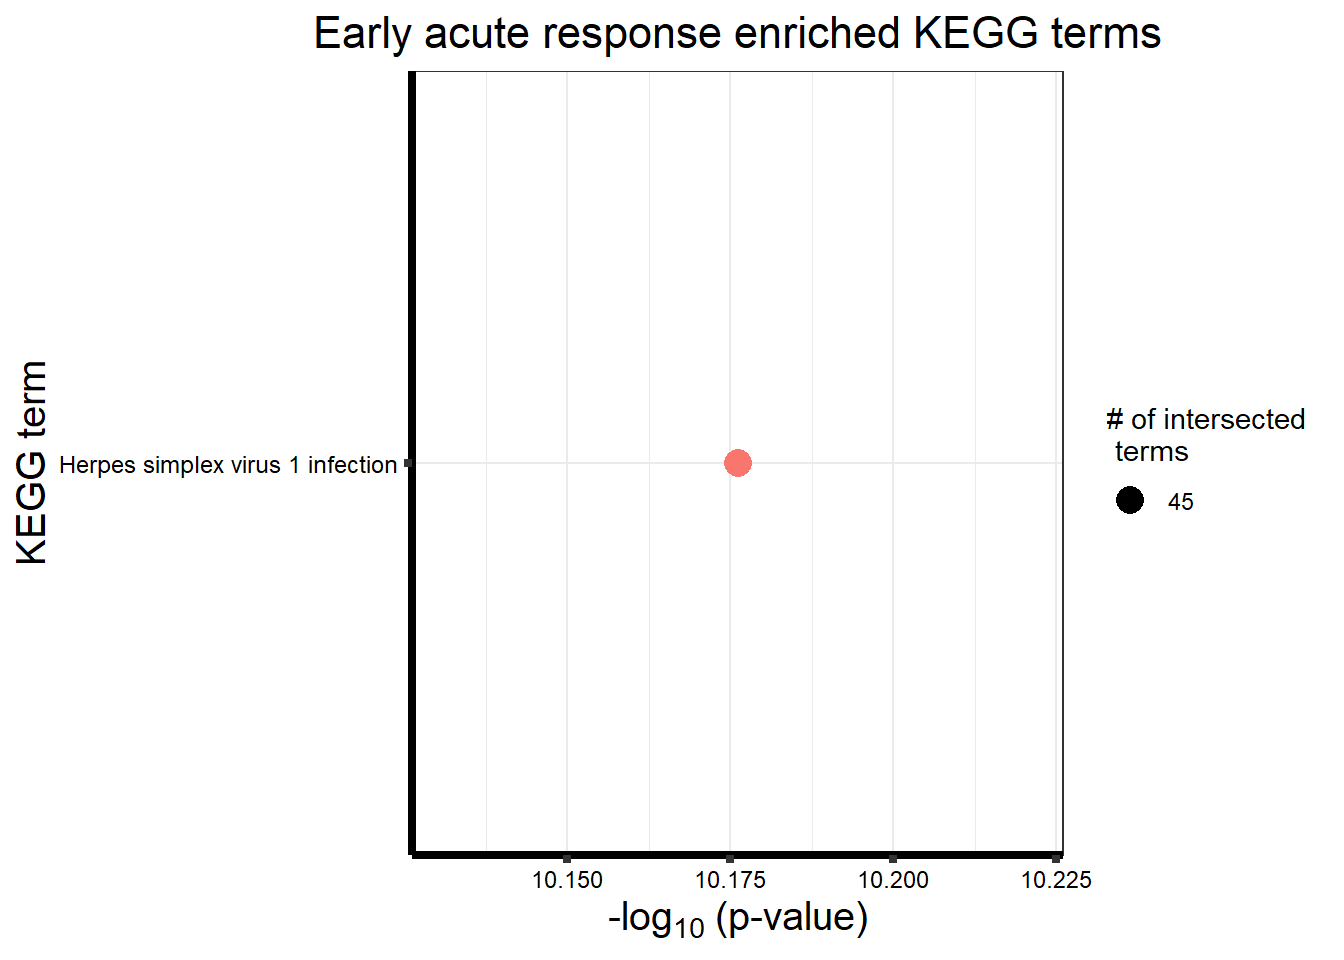
Time-independent Top2inhibitor motif genes
# gostresTop2bi_TI <- gost(query = c(motif_TI),
#                       organism = "hsapiens",
#                       ordered_query = FALSE,
#                       domain_scope = "custom",
#                       measure_underrepresentation = FALSE,
#                       evcodes = FALSE,
#                       user_threshold = 0.05,
#                       correction_method = c("fdr"),
#                       custom_bg = backGL$ENTREZID,
#                       sources=c("GO:BP", "KEGG"))

 # saveRDS(gostresTop2bi_TI, "data/gostresTop2bi_TI.RDS")

gostresTop2bi_TI <- readRDS("data/gostresTop2bi_TI.RDS")
cormotifrespTop2bi_TI <- gostplot(gostresTop2bi_TI, capped = FALSE, interactive = TRUE)
cormotifrespTop2bi_TI
tabletop2Bi_TI <- gostresTop2bi_TI$result %>%
dplyr::select(c(source, term_id, term_name,intersection_size, term_size, p_value))
# write.csv(tabletop2Bi_TI,"output/tabletop2Bi_TI.csv")
tabletop2Bi_TI %>%
mutate_at(.cols = 6, .funs= scales::label_scientific(digits=4)) %>%
kable(.,) %>%
kable_paper("striped", full_width = FALSE) %>%
kable_styling(full_width = FALSE, position = "left",bootstrap_options = c("striped","hover")) %>%
scroll_box(width = "100%", height = "400px")| source | term_id | term_name | intersection_size | term_size | p_value |
|---|---|---|---|---|---|
| GO:BP | GO:0006357 | regulation of transcription by RNA polymerase II | 179 | 1914 | 1.167e-29 |
| GO:BP | GO:0006366 | transcription by RNA polymerase II | 181 | 1995 | 1.181e-28 |
| GO:BP | GO:0006355 | regulation of DNA-templated transcription | 204 | 2574 | 2.150e-25 |
| GO:BP | GO:1903506 | regulation of nucleic acid-templated transcription | 204 | 2576 | 2.150e-25 |
| GO:BP | GO:0051252 | regulation of RNA metabolic process | 217 | 2845 | 2.150e-25 |
| GO:BP | GO:2001141 | regulation of RNA biosynthetic process | 204 | 2593 | 3.638e-25 |
| GO:BP | GO:0097659 | nucleic acid-templated transcription | 206 | 2684 | 3.793e-24 |
| GO:BP | GO:0006351 | DNA-templated transcription | 206 | 2683 | 3.793e-24 |
| GO:BP | GO:0032774 | RNA biosynthetic process | 206 | 2714 | 1.542e-23 |
| GO:BP | GO:0019219 | regulation of nucleobase-containing compound metabolic process | 222 | 3080 | 6.127e-23 |
| GO:BP | GO:0010556 | regulation of macromolecule biosynthetic process | 213 | 3012 | 1.591e-20 |
| GO:BP | GO:0090304 | nucleic acid metabolic process | 258 | 4048 | 5.317e-20 |
| GO:BP | GO:0031326 | regulation of cellular biosynthetic process | 214 | 3080 | 1.030e-19 |
| GO:BP | GO:0009889 | regulation of biosynthetic process | 218 | 3169 | 1.059e-19 |
| GO:BP | GO:0034654 | nucleobase-containing compound biosynthetic process | 213 | 3070 | 1.467e-19 |
| GO:BP | GO:0019438 | aromatic compound biosynthetic process | 215 | 3133 | 2.990e-19 |
| GO:BP | GO:0018130 | heterocycle biosynthetic process | 215 | 3132 | 2.990e-19 |
| GO:BP | GO:0016070 | RNA metabolic process | 236 | 3600 | 3.111e-19 |
| GO:BP | GO:0010468 | regulation of gene expression | 235 | 3580 | 3.256e-19 |
| GO:BP | GO:1901362 | organic cyclic compound biosynthetic process | 217 | 3237 | 3.041e-18 |
| GO:BP | GO:0051171 | regulation of nitrogen compound metabolic process | 260 | 4292 | 4.120e-17 |
| GO:BP | GO:0080090 | regulation of primary metabolic process | 264 | 4417 | 1.085e-16 |
| GO:BP | GO:0060255 | regulation of macromolecule metabolic process | 272 | 4617 | 1.317e-16 |
| GO:BP | GO:0031323 | regulation of cellular metabolic process | 253 | 4174 | 1.876e-16 |
| GO:BP | GO:0006139 | nucleobase-containing compound metabolic process | 262 | 4455 | 1.666e-15 |
| GO:BP | GO:0046483 | heterocycle metabolic process | 265 | 4570 | 6.283e-15 |
| GO:BP | GO:0006725 | cellular aromatic compound metabolic process | 265 | 4596 | 1.371e-14 |
| GO:BP | GO:0019222 | regulation of metabolic process | 282 | 5017 | 1.456e-14 |
| GO:BP | GO:1901360 | organic cyclic compound metabolic process | 268 | 4747 | 1.373e-13 |
| GO:BP | GO:0009059 | macromolecule biosynthetic process | 224 | 3730 | 3.408e-13 |
| GO:BP | GO:0051253 | negative regulation of RNA metabolic process | 98 | 1119 | 3.408e-13 |
| GO:BP | GO:0044271 | cellular nitrogen compound biosynthetic process | 224 | 3750 | 6.248e-13 |
| GO:BP | GO:0000122 | negative regulation of transcription by RNA polymerase II | 74 | 740 | 1.914e-12 |
| GO:BP | GO:0045892 | negative regulation of DNA-templated transcription | 90 | 1015 | 2.605e-12 |
| GO:BP | GO:1903507 | negative regulation of nucleic acid-templated transcription | 90 | 1017 | 2.846e-12 |
| GO:BP | GO:1902679 | negative regulation of RNA biosynthetic process | 90 | 1026 | 4.674e-12 |
| GO:BP | GO:0010467 | gene expression | 256 | 4587 | 5.204e-12 |
| GO:BP | GO:0045934 | negative regulation of nucleobase-containing compound metabolic process | 100 | 1209 | 5.404e-12 |
| GO:BP | GO:0034641 | cellular nitrogen compound metabolic process | 270 | 4946 | 7.415e-12 |
| GO:BP | GO:0045944 | positive regulation of transcription by RNA polymerase II | 80 | 937 | 5.876e-10 |
| GO:BP | GO:0031327 | negative regulation of cellular biosynthetic process | 96 | 1239 | 8.602e-10 |
| GO:BP | GO:0044249 | cellular biosynthetic process | 234 | 4245 | 8.602e-10 |
| GO:BP | GO:0010558 | negative regulation of macromolecule biosynthetic process | 94 | 1214 | 1.521e-09 |
| GO:BP | GO:0009890 | negative regulation of biosynthetic process | 97 | 1280 | 2.241e-09 |
| GO:BP | GO:0043170 | macromolecule metabolic process | 341 | 7069 | 5.242e-09 |
| GO:BP | GO:0050789 | regulation of biological process | 375 | 8061 | 1.411e-08 |
| GO:BP | GO:1901576 | organic substance biosynthetic process | 241 | 4539 | 1.699e-08 |
| GO:BP | GO:0009058 | biosynthetic process | 243 | 4590 | 1.743e-08 |
| GO:BP | GO:1903508 | positive regulation of nucleic acid-templated transcription | 96 | 1315 | 2.052e-08 |
| GO:BP | GO:0045893 | positive regulation of DNA-templated transcription | 96 | 1315 | 2.052e-08 |
| GO:BP | GO:1902680 | positive regulation of RNA biosynthetic process | 96 | 1322 | 2.687e-08 |
| GO:BP | GO:0050794 | regulation of cellular process | 354 | 7552 | 6.948e-08 |
| GO:BP | GO:0031324 | negative regulation of cellular metabolic process | 115 | 1735 | 8.154e-08 |
| GO:BP | GO:0051254 | positive regulation of RNA metabolic process | 100 | 1441 | 1.216e-07 |
| GO:BP | GO:0065007 | biological regulation | 379 | 8320 | 2.560e-07 |
| GO:BP | GO:0010557 | positive regulation of macromolecule biosynthetic process | 101 | 1507 | 6.184e-07 |
| GO:BP | GO:0051173 | positive regulation of nitrogen compound metabolic process | 143 | 2412 | 8.103e-07 |
| GO:BP | GO:0031328 | positive regulation of cellular biosynthetic process | 103 | 1564 | 1.034e-06 |
| GO:BP | GO:0051172 | negative regulation of nitrogen compound metabolic process | 116 | 1849 | 1.530e-06 |
| GO:BP | GO:0045935 | positive regulation of nucleobase-containing compound metabolic process | 104 | 1602 | 1.778e-06 |
| GO:BP | GO:0010604 | positive regulation of macromolecule metabolic process | 152 | 2646 | 1.826e-06 |
| GO:BP | GO:0009891 | positive regulation of biosynthetic process | 104 | 1604 | 1.837e-06 |
| GO:BP | GO:0010605 | negative regulation of macromolecule metabolic process | 128 | 2135 | 3.184e-06 |
| GO:BP | GO:0009893 | positive regulation of metabolic process | 160 | 2880 | 6.139e-06 |
| GO:BP | GO:0009892 | negative regulation of metabolic process | 134 | 2293 | 6.139e-06 |
| GO:BP | GO:0031325 | positive regulation of cellular metabolic process | 133 | 2270 | 6.139e-06 |
| GO:BP | GO:0006807 | nitrogen compound metabolic process | 340 | 7441 | 1.121e-05 |
| GO:BP | GO:0044238 | primary metabolic process | 350 | 7806 | 5.451e-05 |
| GO:BP | GO:0071704 | organic substance metabolic process | 362 | 8169 | 8.965e-05 |
| GO:BP | GO:0044237 | cellular metabolic process | 319 | 6996 | 8.965e-05 |
| GO:BP | GO:0003007 | heart morphogenesis | 24 | 216 | 1.824e-04 |
| GO:BP | GO:0009952 | anterior/posterior pattern specification | 17 | 127 | 4.487e-04 |
| GO:BP | GO:0045595 | regulation of cell differentiation | 72 | 1137 | 7.662e-04 |
| GO:BP | GO:0048523 | negative regulation of cellular process | 181 | 3625 | 9.101e-04 |
| GO:BP | GO:0048645 | animal organ formation | 10 | 51 | 1.259e-03 |
| GO:BP | GO:0045596 | negative regulation of cell differentiation | 37 | 482 | 2.670e-03 |
| GO:BP | GO:0140467 | integrated stress response signaling | 8 | 35 | 2.670e-03 |
| GO:BP | GO:0060411 | cardiac septum morphogenesis | 11 | 67 | 2.686e-03 |
| GO:BP | GO:0007389 | pattern specification process | 27 | 306 | 2.869e-03 |
| GO:BP | GO:0008152 | metabolic process | 366 | 8518 | 3.170e-03 |
| GO:BP | GO:0045597 | positive regulation of cell differentiation | 44 | 620 | 3.172e-03 |
| GO:BP | GO:0060537 | muscle tissue development | 29 | 343 | 3.172e-03 |
| GO:BP | GO:0014706 | striated muscle tissue development | 21 | 210 | 3.236e-03 |
| GO:BP | GO:0048738 | cardiac muscle tissue development | 20 | 198 | 4.167e-03 |
| GO:BP | GO:0060914 | heart formation | 7 | 29 | 5.075e-03 |
| GO:BP | GO:0048518 | positive regulation of biological process | 214 | 4579 | 7.246e-03 |
| GO:BP | GO:0003002 | regionalization | 24 | 273 | 7.258e-03 |
| GO:BP | GO:2000026 | regulation of multicellular organismal development | 62 | 1014 | 7.566e-03 |
| GO:BP | GO:0035914 | skeletal muscle cell differentiation | 9 | 52 | 7.737e-03 |
| GO:BP | GO:0051094 | positive regulation of developmental process | 59 | 957 | 8.730e-03 |
| GO:BP | GO:0048519 | negative regulation of biological process | 191 | 4045 | 1.183e-02 |
| GO:BP | GO:0035880 | embryonic nail plate morphogenesis | 3 | 4 | 1.183e-02 |
| GO:BP | GO:0021546 | rhombomere development | 3 | 4 | 1.183e-02 |
| GO:BP | GO:0003151 | outflow tract morphogenesis | 10 | 68 | 1.281e-02 |
| GO:BP | GO:0051093 | negative regulation of developmental process | 44 | 665 | 1.334e-02 |
| GO:BP | GO:0007049 | cell cycle | 84 | 1529 | 1.667e-02 |
| GO:BP | GO:0043009 | chordate embryonic development | 37 | 534 | 1.700e-02 |
| GO:BP | GO:0051239 | regulation of multicellular organismal process | 106 | 2035 | 1.822e-02 |
| GO:BP | GO:0050793 | regulation of developmental process | 97 | 1835 | 2.051e-02 |
| GO:BP | GO:0001756 | somitogenesis | 8 | 48 | 2.121e-02 |
| GO:BP | GO:0030336 | negative regulation of cell migration | 20 | 227 | 2.191e-02 |
| GO:BP | GO:0048522 | positive regulation of cellular process | 191 | 4099 | 2.296e-02 |
| GO:BP | GO:0051726 | regulation of cell cycle | 57 | 956 | 2.316e-02 |
| GO:BP | GO:0060284 | regulation of cell development | 40 | 605 | 2.365e-02 |
| GO:BP | GO:0051241 | negative regulation of multicellular organismal process | 47 | 748 | 2.370e-02 |
| GO:BP | GO:0045598 | regulation of fat cell differentiation | 12 | 102 | 2.370e-02 |
| GO:BP | GO:0035282 | segmentation | 10 | 75 | 2.530e-02 |
| GO:BP | GO:0048483 | autonomic nervous system development | 6 | 28 | 2.601e-02 |
| GO:BP | GO:0009792 | embryo development ending in birth or egg hatching | 37 | 551 | 2.744e-02 |
| GO:BP | GO:0002294 | CD4-positive, alpha-beta T cell differentiation involved in immune response | 7 | 40 | 3.146e-02 |
| GO:BP | GO:0060412 | ventricular septum morphogenesis | 7 | 40 | 3.146e-02 |
| GO:BP | GO:0002293 | alpha-beta T cell differentiation involved in immune response | 7 | 40 | 3.146e-02 |
| GO:BP | GO:0002287 | alpha-beta T cell activation involved in immune response | 7 | 40 | 3.146e-02 |
| GO:BP | GO:0042093 | T-helper cell differentiation | 7 | 40 | 3.146e-02 |
| GO:BP | GO:2000146 | negative regulation of cell motility | 20 | 236 | 3.158e-02 |
| GO:BP | GO:0055017 | cardiac muscle tissue growth | 9 | 65 | 3.329e-02 |
| GO:BP | GO:0045444 | fat cell differentiation | 17 | 187 | 3.493e-02 |
| GO:BP | GO:0048486 | parasympathetic nervous system development | 4 | 12 | 3.493e-02 |
| GO:BP | GO:0060429 | epithelium development | 51 | 850 | 3.493e-02 |
| GO:BP | GO:0048729 | tissue morphogenesis | 34 | 504 | 3.788e-02 |
| GO:BP | GO:0003206 | cardiac chamber morphogenesis | 12 | 109 | 3.788e-02 |
| GO:BP | GO:0007517 | muscle organ development | 22 | 277 | 3.929e-02 |
| GO:BP | GO:0002292 | T cell differentiation involved in immune response | 7 | 42 | 3.951e-02 |
| GO:BP | GO:0007507 | heart development | 34 | 506 | 3.952e-02 |
| GO:BP | GO:0060562 | epithelial tube morphogenesis | 22 | 278 | 4.020e-02 |
| GO:BP | GO:0048568 | embryonic organ development | 24 | 316 | 4.247e-02 |
| GO:BP | GO:1900744 | regulation of p38MAPK cascade | 6 | 32 | 4.660e-02 |
| GO:BP | GO:0060840 | artery development | 10 | 83 | 4.660e-02 |
| GO:BP | GO:0042127 | regulation of cell population proliferation | 64 | 1147 | 4.660e-02 |
| GO:BP | GO:0003281 | ventricular septum development | 9 | 69 | 4.660e-02 |
| GO:BP | GO:1902893 | regulation of miRNA transcription | 8 | 56 | 4.670e-02 |
| GO:BP | GO:0040013 | negative regulation of locomotion | 21 | 265 | 4.839e-02 |
| GO:BP | GO:0060038 | cardiac muscle cell proliferation | 7 | 44 | 4.861e-02 |
| GO:BP | GO:0010628 | positive regulation of gene expression | 47 | 783 | 4.922e-02 |
| GO:BP | GO:0030278 | regulation of ossification | 10 | 84 | 4.925e-02 |
| GO:BP | GO:0014855 | striated muscle cell proliferation | 8 | 57 | 4.953e-02 |
| GO:BP | GO:0045667 | regulation of osteoblast differentiation | 11 | 99 | 4.953e-02 |
| GO:BP | GO:0061614 | miRNA transcription | 8 | 57 | 4.953e-02 |
| GO:BP | GO:0040007 | growth | 45 | 742 | 4.953e-02 |
| KEGG | KEGG:05168 | Herpes simplex virus 1 infection | 47 | 415 | 3.765e-09 |
| KEGG | KEGG:04115 | p53 signaling pathway | 11 | 65 | 3.175e-03 |
| KEGG | KEGG:05217 | Basal cell carcinoma | 9 | 49 | 5.764e-03 |
| KEGG | KEGG:05224 | Breast cancer | 14 | 117 | 5.917e-03 |
| KEGG | KEGG:05225 | Hepatocellular carcinoma | 16 | 145 | 5.917e-03 |
| KEGG | KEGG:05226 | Gastric cancer | 13 | 117 | 1.757e-02 |
| KEGG | KEGG:05202 | Transcriptional misregulation in cancer | 13 | 128 | 3.526e-02 |
  tabletop2Bi_TI %>%
    dplyr::filter(source =="GO:BP") %>%
    dplyr::select(p_value,term_name,intersection_size) %>%
    slice_min(., n=13 ,order_by=p_value) %>%
    mutate(log_val = -log10(p_value)) %>%
   # slice_max(., n=10,order_by = p_value) %>%
   ggplot(., aes(x = log_val, y =reorder(term_name,p_value),col=intersection_size)) +
    geom_point(aes(size = intersection_size)) +
    scale_y_discrete(labels = scales::label_wrap(35))+
    guides(col="none", size=guide_legend(title = "# of intersected \n terms"))+
    ggtitle('Early sustained response enriched GO:BP terms') +
    xlab(expression("-log"[10]~"(p-value)"))+
    #scale_x_continuous(expand = expansion(mult = .2))+
    ylab("GO: BP term")+
     theme_bw()+
 theme(plot.title = element_text(size = rel(1.5), hjust = 0.5),
        axis.title = element_text(size = 15, color = "black"),
        axis.ticks = element_line(linewidth = 1.5),
        axis.line = element_line(linewidth = 1.5),
        axis.text = element_text(size = 8, color = "black", angle = 0),
        strip.text.x = element_text(size = 15, color = "black", face = "bold"))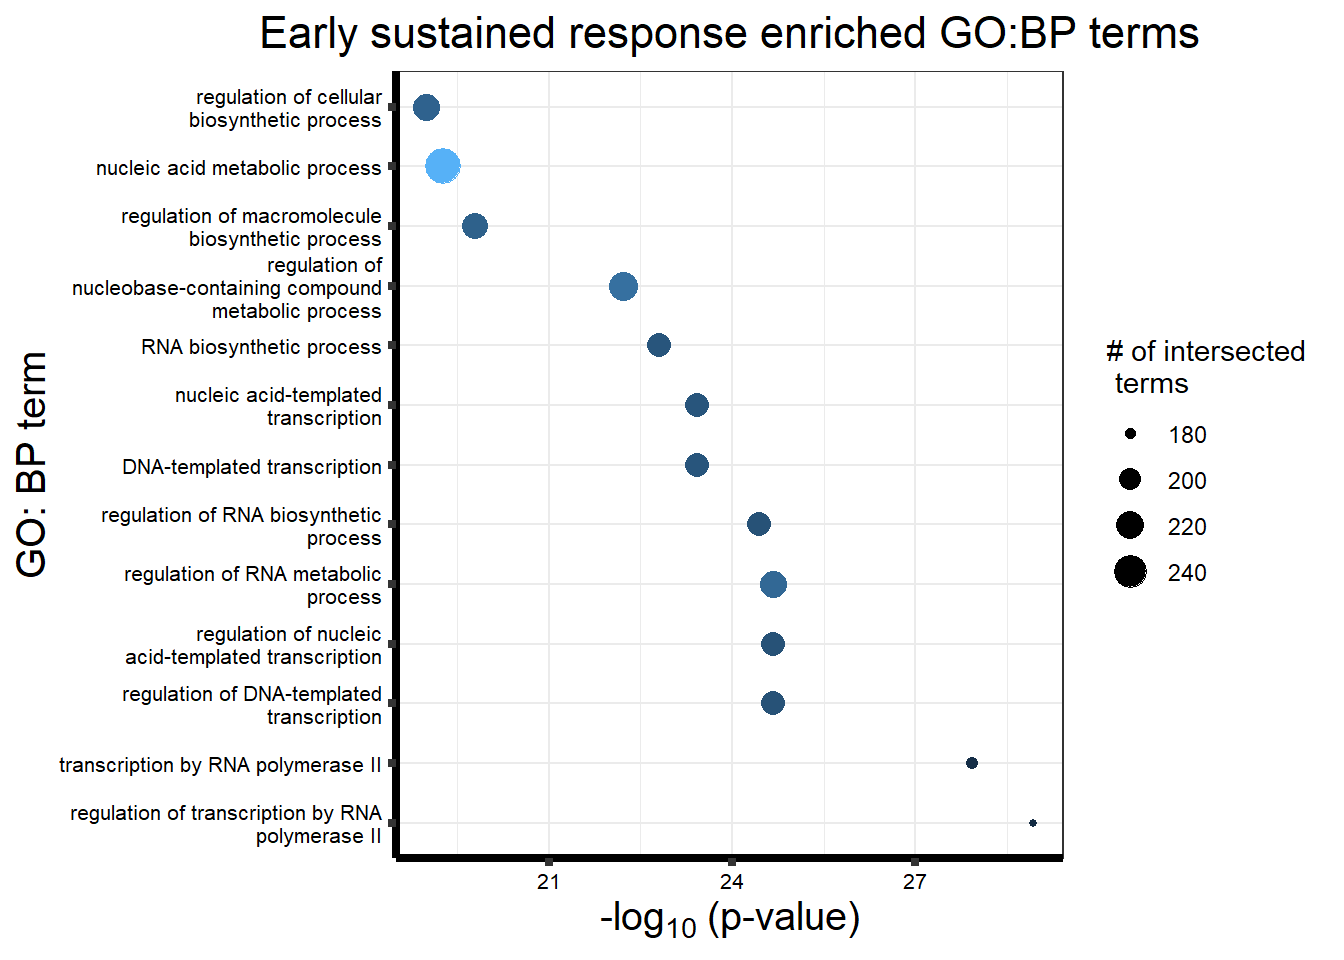
  tabletop2Bi_TI %>%
    dplyr::filter(source =="KEGG") %>%
    dplyr::select(p_value,term_name,intersection_size) %>%
    slice_min(., n=15 ,order_by=p_value) %>%
    mutate(log_val = -log10(p_value)) %>%
   # slice_max(., n=10,order_by = p_value) %>%
   ggplot(., aes(x = log_val, y =reorder(term_name,p_value),col=intersection_size)) +
    geom_point(aes(size = intersection_size, col="red")) +
  scale_y_discrete(labels = scales::label_wrap(35))+
    guides(col="none", size=guide_legend(title = "# of intersected \n terms"))+
    ggtitle('Early sustained response KEGG terms') +
   xlab(expression("-log"[10]~"(p-value)"))+
    #scale_x_continuous(expand = expansion(mult = .2))+
    ylab("KEGG term")+
      theme_bw()+
 theme(plot.title = element_text(size = rel(1.5), hjust = 0.5),
        axis.title = element_text(size = 15, color = "black"),
        axis.ticks = element_line(linewidth = 1.5),
        axis.line = element_line(linewidth = 1.5),
        axis.text = element_text(size = 9, color = "black", angle = 0),
        strip.text.x = element_text(size = 15, color = "black", face = "bold"))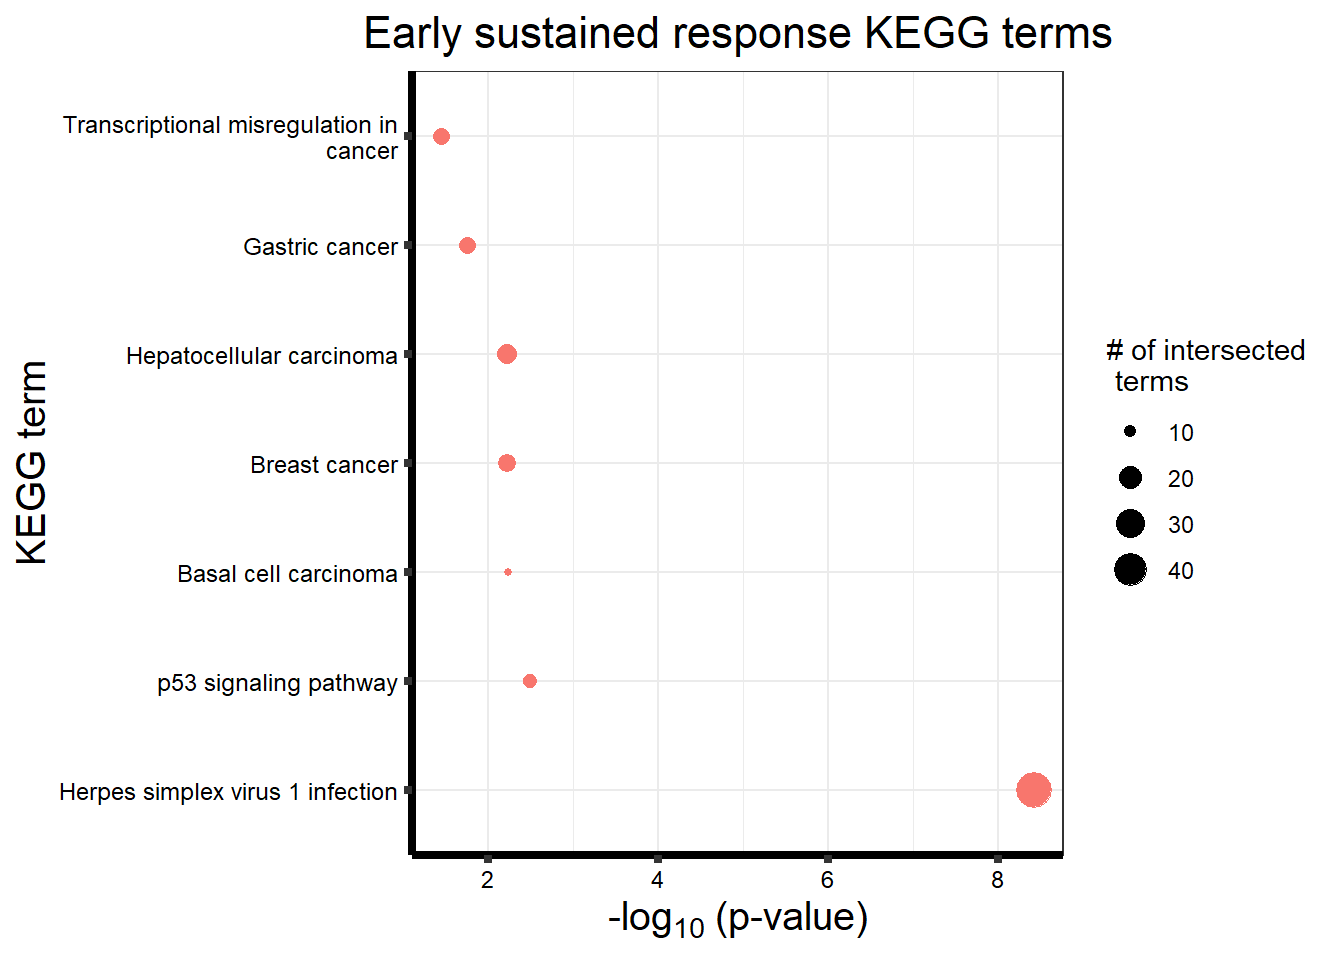
long GO:BP frame
motifcol <- c("#F8766D", "#00BFC4","#7CAE00",  "#C77CFF")
NR1f <- tableNR %>% dplyr::filter(source=="GO:BP") %>%
    dplyr::select(p_value,term_name,intersection_size) %>%
    slice_min(., n=10 ,order_by=p_value) %>%
    mutate(log_val = -log10(p_value)) %>%mutate(order_val=rev(as.numeric(rownames(.))))

LR3f <- tabletop2Bi_LR %>% dplyr::filter(source=="GO:BP") %>%
    dplyr::select(p_value,term_name,intersection_size) %>%
    slice_min(., n=9 ,order_by=p_value) %>%
    mutate(log_val = -log10(p_value))  %>%  mutate(order_val=rev(as.numeric(rownames(.))))


TI3f <- tabletop2Bi_TI %>%
    dplyr::filter(source =="GO:BP") %>%
    dplyr::select(p_value,term_name,intersection_size) %>%
    slice_min(., n=10 ,order_by=p_value) %>%
    mutate(log_val = -log10(p_value))  %>% mutate(order_val=rev(as.numeric(rownames(.))))

ER3f <- tabletop2Bi_ER %>%
    dplyr::filter(source =="GO:BP") %>%
    dplyr::select(p_value,term_name,intersection_size) %>%
    slice_min(., n=10 ,order_by=p_value) %>%
    mutate(log_val = -log10(p_value))  %>% mutate(order_val=rev(as.numeric(rownames(.))))
# motif_list_GO <- list(ER3f,TI3f,LR3f,NR1f)
# names(motif_list_GO) <- c("ER3f","TI3f","LR3f","NR1f")
# saveRDS(motif_list_GO,"output/supplementary_motif_list_GO.RDS")

GOmotiflong <-list("EAR"=ER3f,"ESR"=TI3f,"LR"=LR3f, "NR"=NR1f)
GOBPlong <- data.table::rbindlist(GOmotiflong, idcol = "motif")
p <- GOBPlong %>% mutate(motif=factor(motif,levels=c("EAR","ESR","LR","NR"))) %>%

ggplot(., aes(x = log_val, y=reorder(term_name, order_val, desc=FALSE),col=motif)) +
    geom_point(aes(size = intersection_size, col=motif)) +
  scale_y_discrete(labels = scales::label_wrap(40))+
  facet_grid(motif~., scales = "free_y")+
  scale_color_discrete(type=motifcol)+

    guides(col=guide_legend(title="Motif group"), size=guide_legend(title = "# of intersected \n terms"))+
    ggtitle('Top 10 enriched GO:BP terms for each motif') +
     xlab(expression("-log"[10]~"(p-value)"))+
    #scale_x_continuous(expand = expansion(mult = .2))+
    ylab("GO:BP term")+
      theme_bw()+
 theme(plot.title = element_text(size = rel(1.5), hjust = 0.5),
        axis.title = element_text(size = 15, color = "black"),
        axis.ticks = element_line(linewidth = 1.5),
        axis.line = element_line(linewidth = 1.5),
        axis.text = element_text(size = 8, color = "black", angle = 0),
        strip.text.x = element_text(size = 15, color = "black", face = "bold"))


#https://stackoverflow.com/questions/41631806/change-facet-label-text-and-background-colour/60046113#60046113
g <- ggplot_gtable(ggplot_build(p))
stripr <- which(grepl('strip-r', g$layout$name))
fills <- c("#F8766D", "#00BFC4","#7CAE00",  "#C77CFF")
k <- 1
for (i in stripr) {
  j <- which(grepl('rect', g$grobs[[i]]$grobs[[1]]$childrenOrder))
  g$grobs[[i]]$grobs[[1]]$children[[j]]$gp$fill <- fills[k]
  k <- k+1
}
#print(grid::grid.draw(g))
grid.draw(g)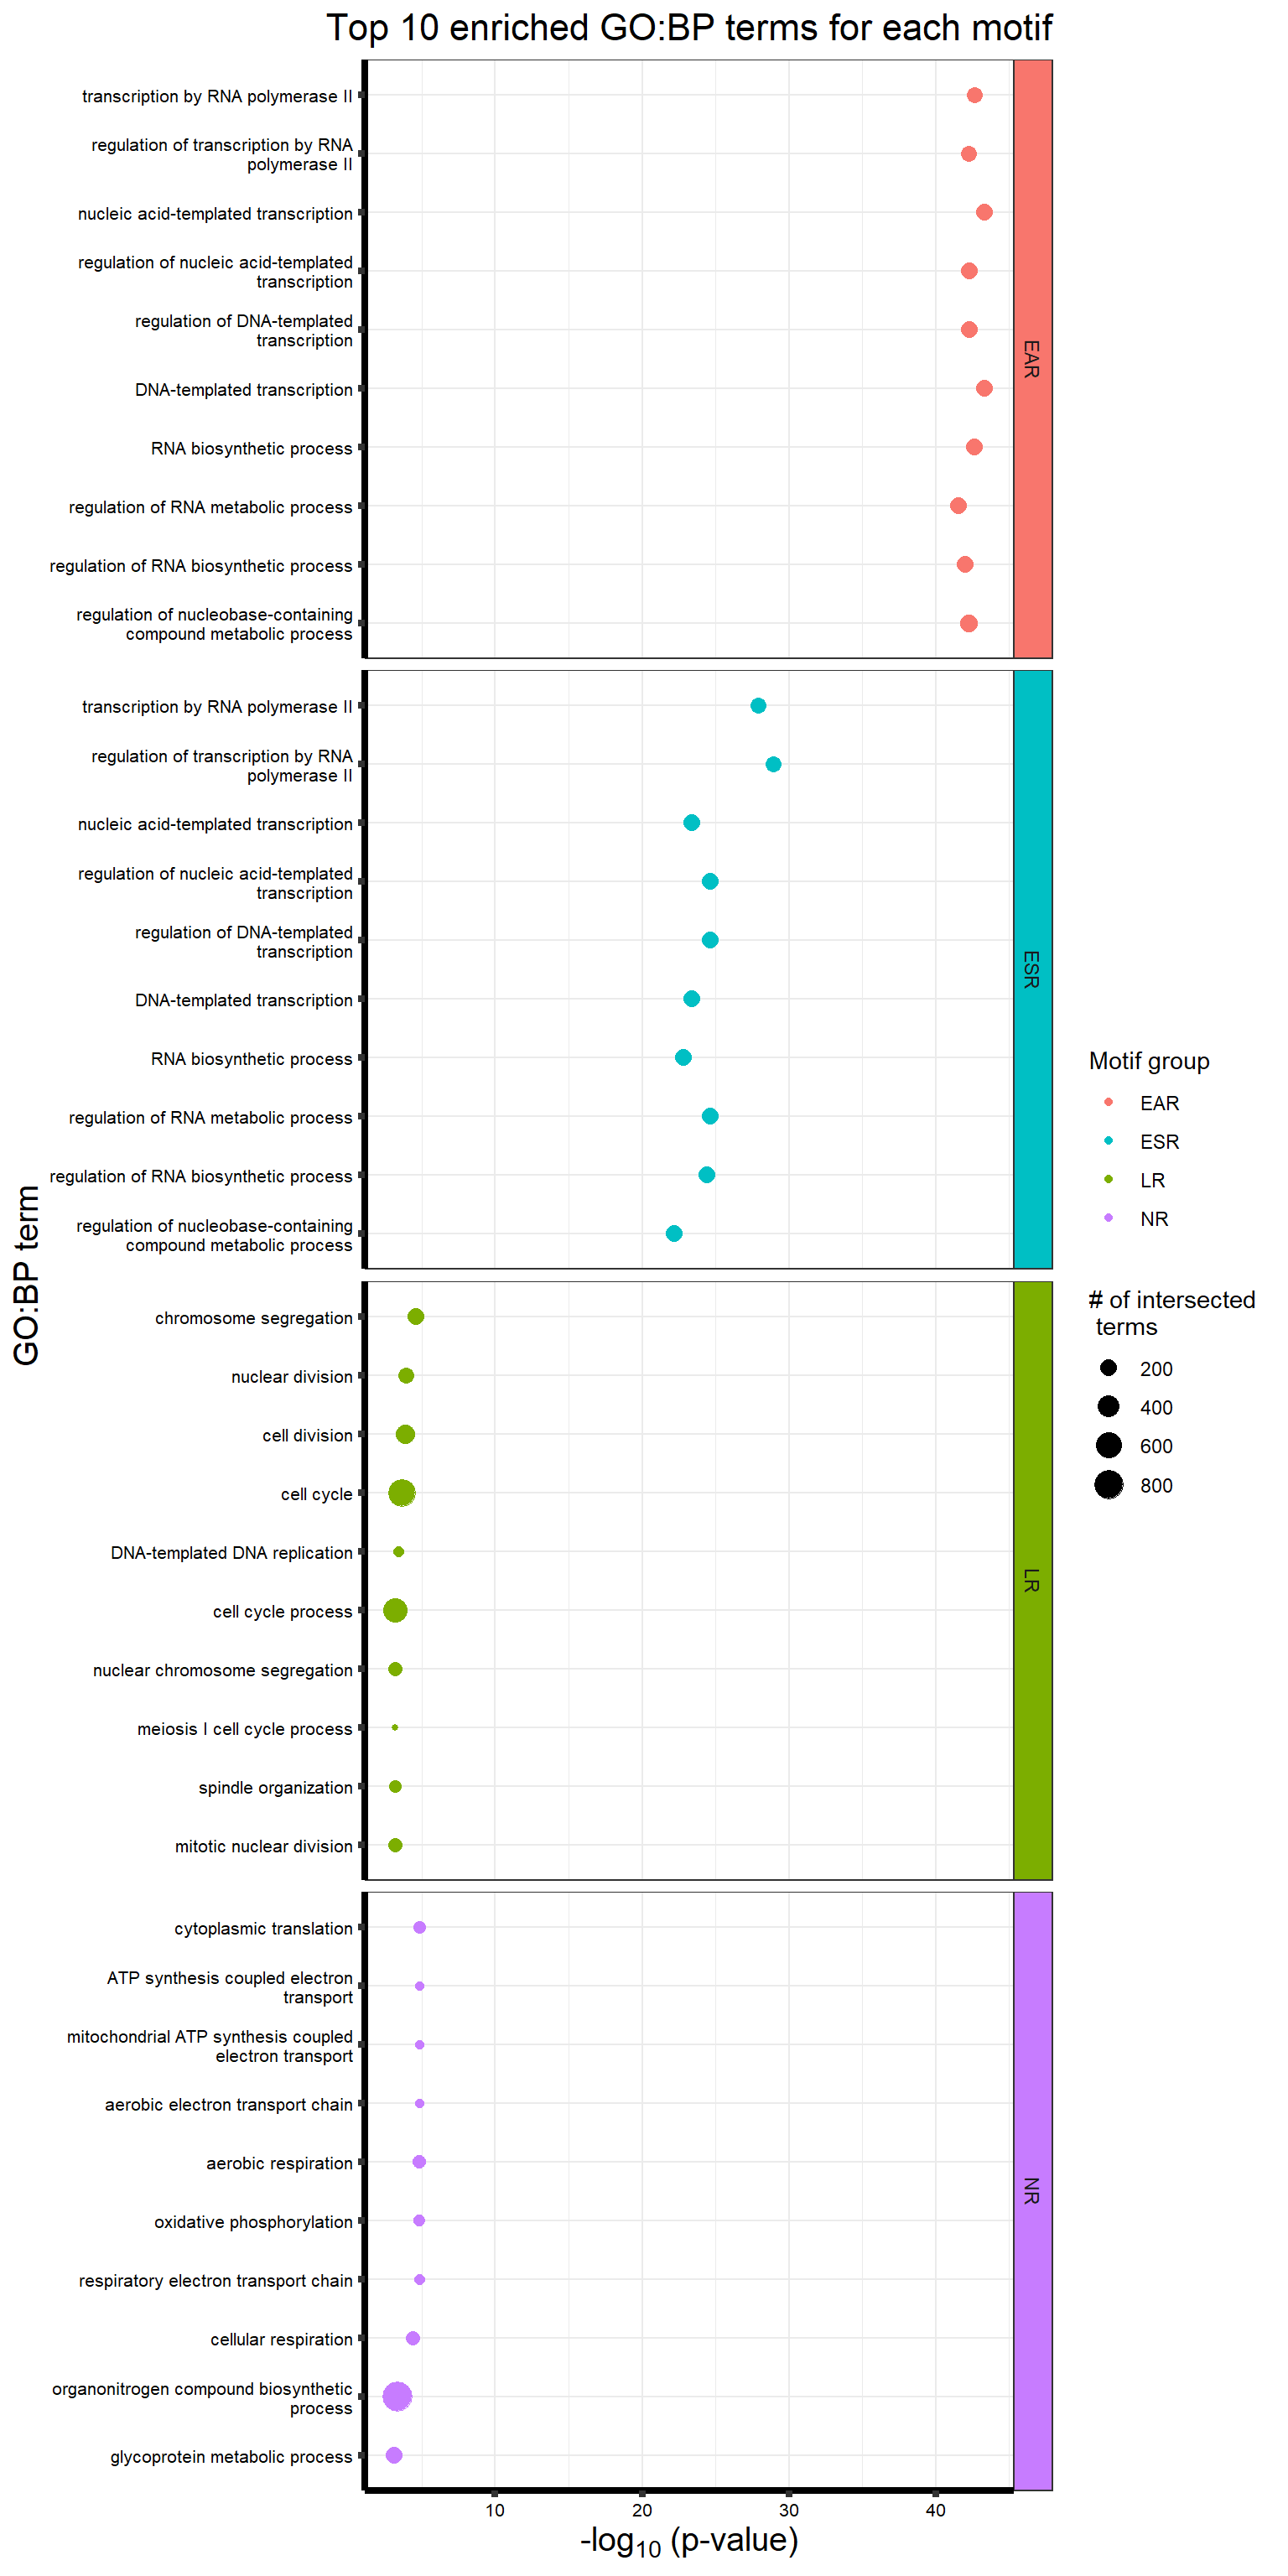
#hex <- hue_pal()(4)

#hex
#> hex (red/green/blue/purple default in ggplot)
#[1] "#F8766D" "#7CAE00" "#00BFC4" "#C77CFF"
#p
long go KEGG frame
LR3fk <- tabletop2Bi_LR %>% dplyr::filter(source=="KEGG") %>%
    dplyr::select(p_value,term_name,intersection_size) %>%
    slice_min(., n=10 ,order_by=p_value) %>%
    mutate(log_val = -log10(p_value))


TI3fk <- tabletop2Bi_TI %>%
    dplyr::filter(source =="KEGG") %>%
    dplyr::select(p_value,term_name,intersection_size) %>%
    slice_min(., n=10 ,order_by=p_value) %>%
    mutate(log_val = -log10(p_value))

ER3fk <- tabletop2Bi_ER %>%
    dplyr::filter(source =="KEGG") %>%
    dplyr::select(p_value,term_name,intersection_size) %>%
    slice_min(., n=10 ,order_by=p_value) %>%
    mutate(log_val = -log10(p_value))

KEGGmotiflong <-list("ER"=ER3fk,"LR"=LR3fk,"TI"=TI3fk)
KEGGlong <- data.table::rbindlist(KEGGmotiflong, idcol = "motif")
KEGGlong %>% group_by(motif) %>%
ggplot(., aes(x = log_val, y =reorder(term_name,p_value,desc=FALSE),col=motif)) +
    geom_point(aes(size = intersection_size, col=motif)) +
  scale_y_discrete(limits=rev,labels = scales::label_wrap(30))+
    guides(col=guide_legend(title="Motif group"), size=guide_legend(title = "# of intersected \n terms"))+
    ggtitle('Top enriched KEGG terms for each motif') +
    xlab(expression("-log"[10]~"(p-value)"))+
    #scale_x_continuous(expand = expansion(mult = .2))+
    ylab("KEGG term")+
      theme_bw()+
 theme(plot.title = element_text(size = rel(1.5), hjust = 0.5),
        axis.title = element_text(size = 15, color = "black"),
        axis.ticks = element_line(linewidth = 1.5),
        axis.line = element_line(linewidth = 1.5),
        axis.text = element_text(size = 9, color = "black", angle = 0),
        strip.text.x = element_text(size = 15, color = "black", face = "bold"))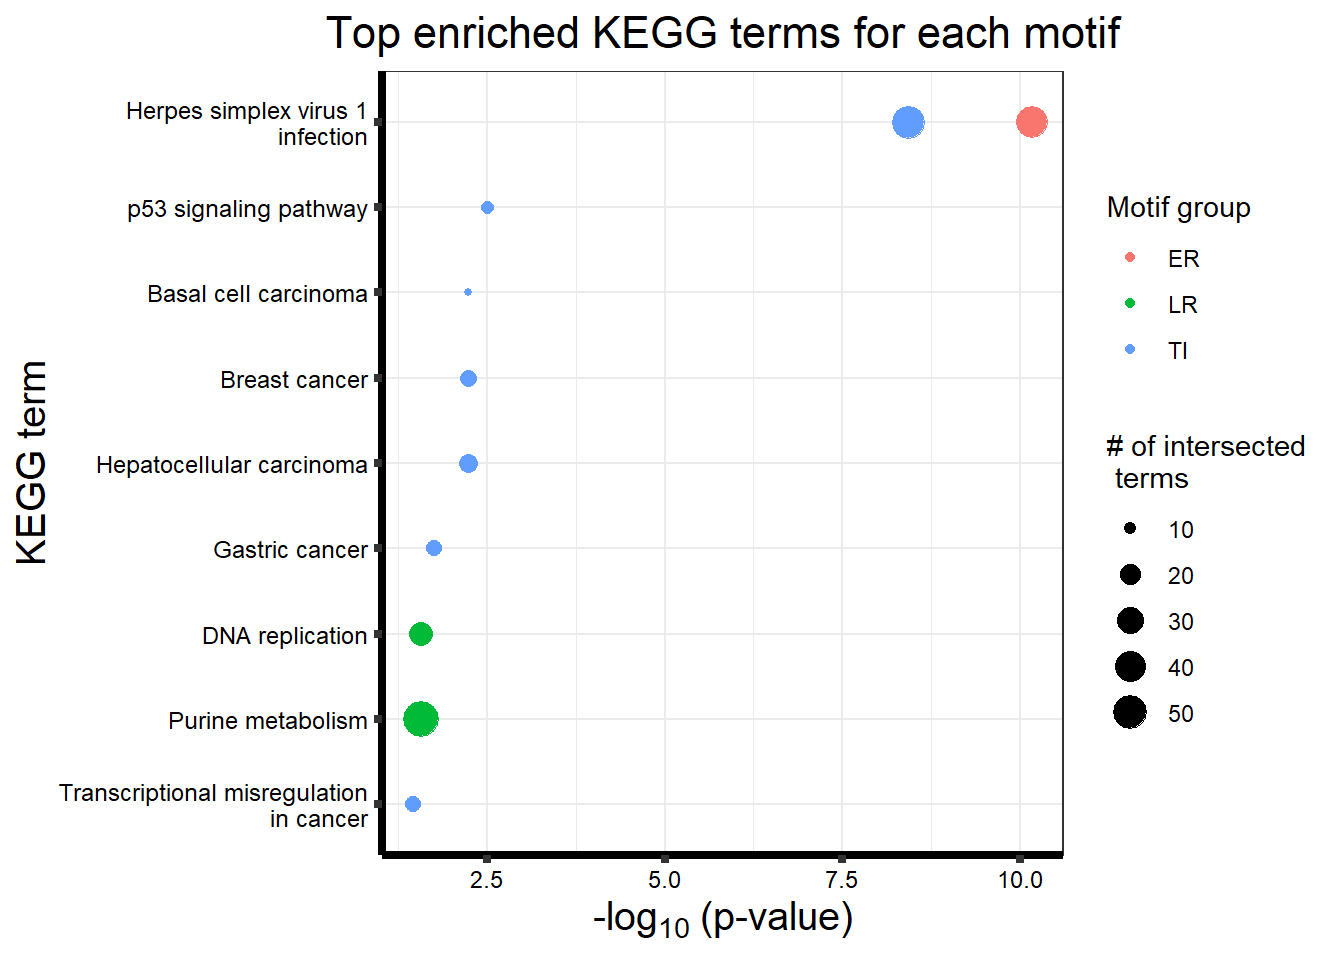
Example of genes from each cluster
Motif_NR
drug_pal_fact <- c("#8B006D","#DF707E","#F1B72B", "#3386DD","#707031","#41B333")

drug_pal <- c("#41B333","#8B006D","#DF707E","#F1B72B", "#3386DD","#707031")
#fills <- c("#F8766D", "#7CAE00", "#00BFC4", "#C77CFF")

DEG_cormotif <- readRDS("data/DEG_cormotif.RDS")
list2env(DEG_cormotif,envir=.GlobalEnv)
<environment: R_GlobalEnv>set.seed(12345)
geneexpressionsets <- c( "27102" , "92312" , "10360", "388558")
cpmcounts <- readRDS("data/cpmcount.RDS")
cpmcounts %>% dplyr::filter(rownames(.)==geneexpressionsets[1]) %>%
pivot_longer(everything(), names_to = "treatment",values_to = "counts") %>%
mutate(drug=rep(c("DNR","DOX","EPI","MTX","TRZ", "VEH"),12)) %>%
mutate(drug=factor(drug, levels = c('DOX','EPI','DNR','MTX','TRZ','VEH'))) %>%
mutate(time = rep((rep(c("3h", "24h"), c(6,6))), 6)) %>%
mutate(time=factor(time, levels =c("3h", "24h"))) %>%
mutate(indv=factor(rep(c(1,2,3,4,5,6), c(12,12,12,12,12,12)))) %>%
ggplot(., aes(x=drug, y=counts))+
geom_boxplot(position="identity",aes(fill=drug))+
geom_point(aes(col=indv, size=2, alpha=0.5))+
guides(alpha= "none", size= "none", indv="none")+
scale_color_brewer(palette = "Dark2",guide = "none")+
scale_fill_manual(values=drug_pal_fact)+
facet_wrap("time", nrow=1, ncol=2)+
theme_bw()+
ylab(expression(atop("No Response set",italic("GCNT1")~log[2]~"cpm ")))+
xlab("")+
theme(strip.background = element_rect(fill = "#C77CFF"),
plot.title = element_text(size=18,hjust = 0.5),
axis.title = element_text(size = 15, color = "black"),
axis.ticks = element_line(linewidth = 1.5),
axis.line = element_line(linewidth = 1.5),
axis.text.x = element_text(size = 12, color = "white", angle = 0),
strip.text.x = element_text(size = 15, color = "black", face = "bold"))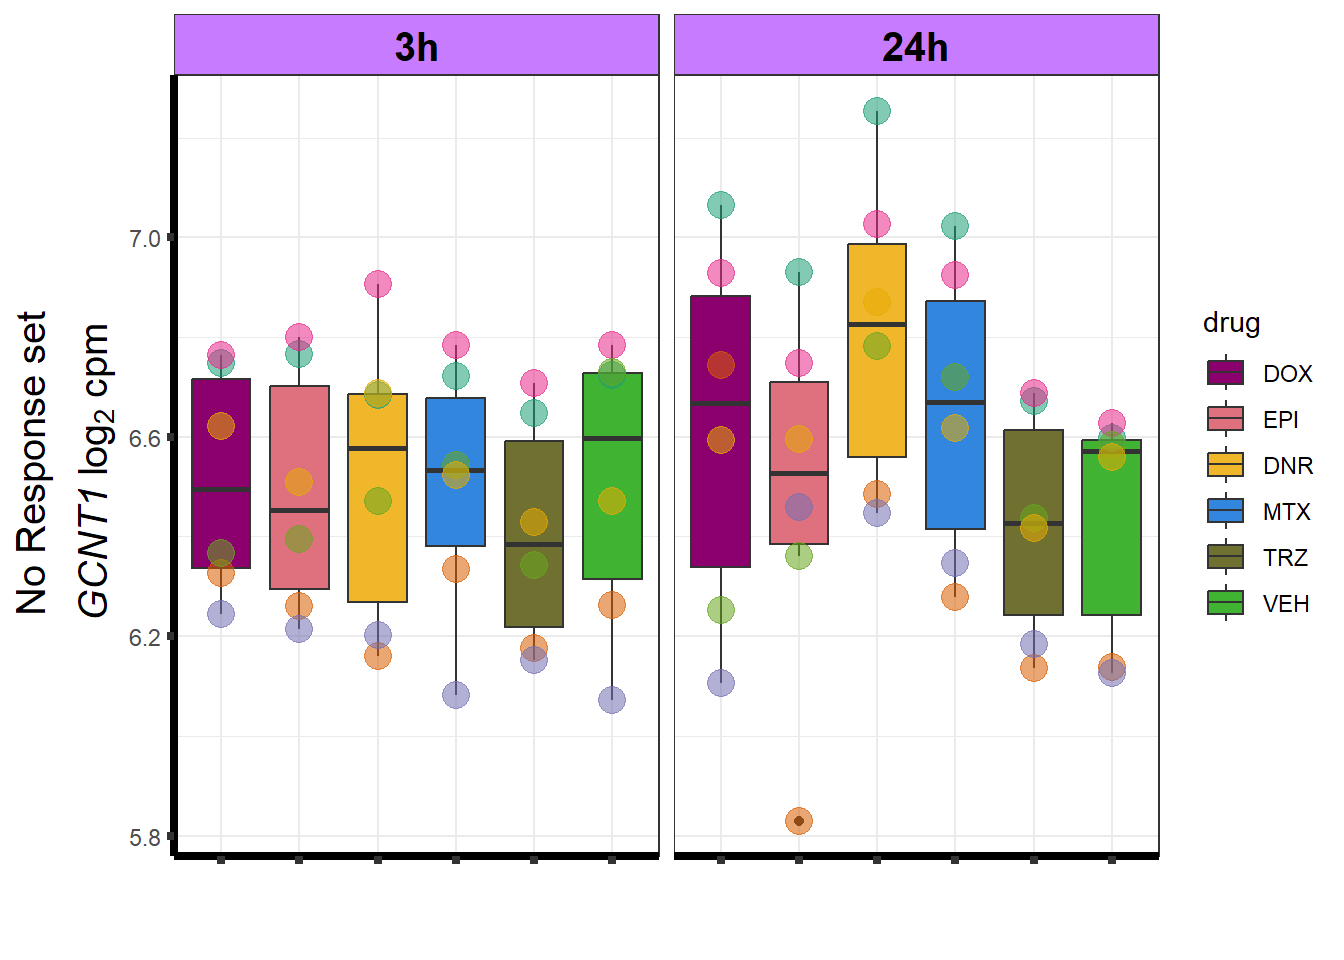
# saveRDS(motif_NRrep,"output/motif_NRrep.RDS")Log-Fold Change of Motif_NR
lfc_nums <- readRDS("data/toplistall.RDS")
lfc_nums %>%
  dplyr::filter(ENTREZID %in% clust1) %>%
  mutate(absFC=abs(logFC)) %>%
  mutate(id=factor(id, levels = c('DOX','EPI','DNR','MTX','TRZ','VEH'))) %>%
  mutate(time=factor(time, levels=c("3_hours","24_hours"), labels = c(" 3 hours", "24 hours"))) %>%
  ggplot(., aes(x=id,y=absFC))+
  geom_boxplot(aes(fill=id))+
  scale_fill_manual(values=drug_pal_fact)+
  guides(fill=guide_legend(title = "Treatment"))+
  facet_wrap(~time)+
  theme_bw()+
  xlab(" ")+
  ylab("|Log Fold Change|")+
  theme_bw()+
  ggtitle("|Log Fold| for all genes in NR set")+
  theme(plot.title = element_text(size = rel(1.5), hjust = 0.5),
        axis.title = element_text(size = 15, color = "black"),
        axis.line = element_line(linewidth = 1.5),
        strip.background = element_rect(fill = "#C77CFF"),
        axis.text.x = element_text(size = 8, color = "white", angle = 15),
        strip.text.x = element_text(size = 12, color = "black", face = "bold"))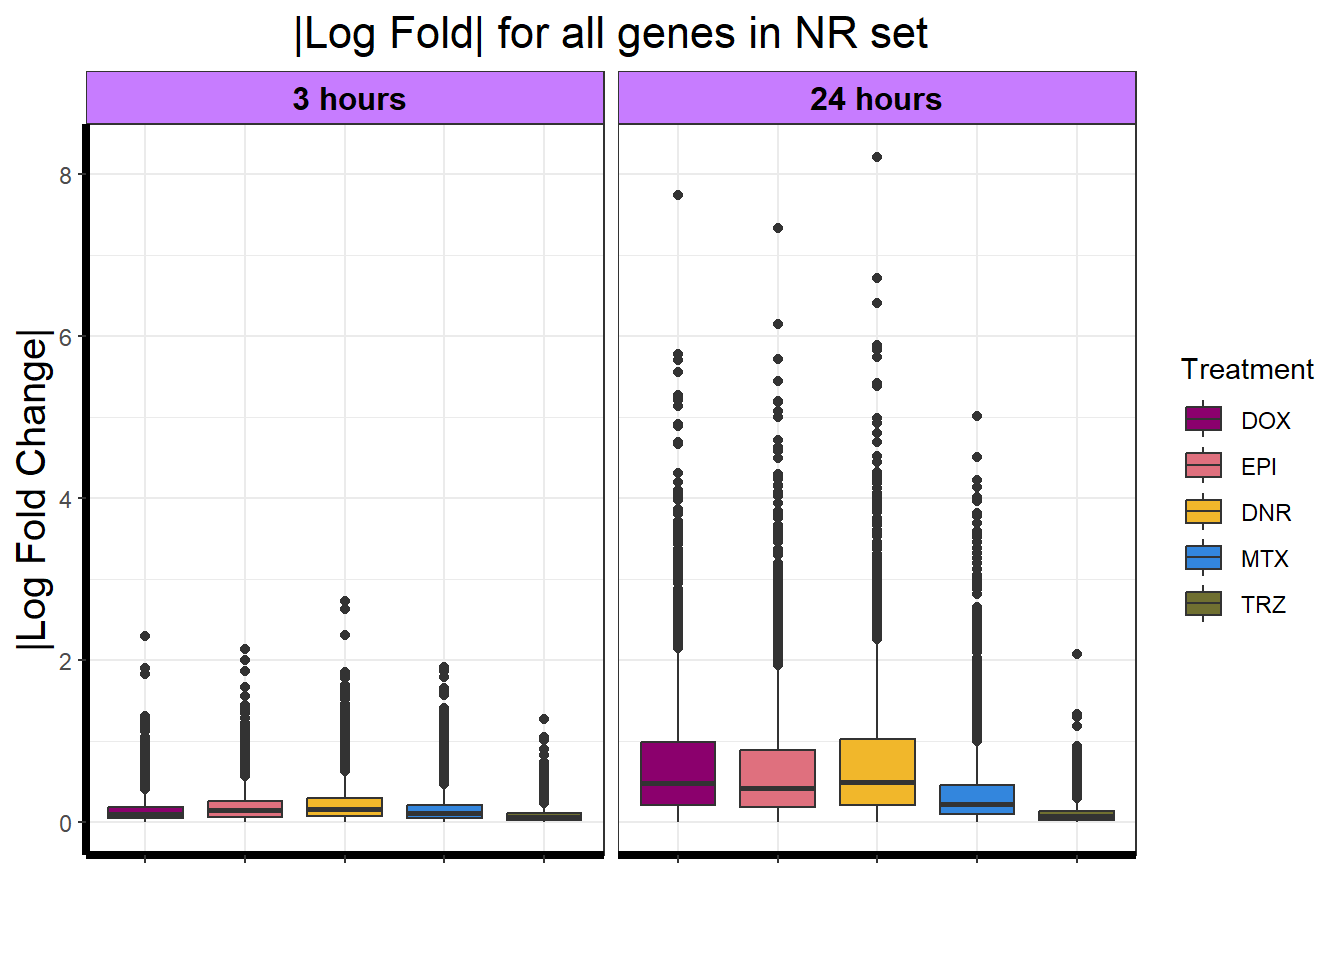
Motif_TI
#
# motif_TI_rep <-
  cpmcounts %>% dplyr::filter(rownames(.)==92312) %>%
  pivot_longer(everything(), names_to = "treatment",values_to = "counts") %>%
  mutate(drug=rep(c("DNR","DOX","EPI","MTX","TRZ", "VEH"),12)) %>%
  mutate(drug=factor(drug, levels = c('DOX','EPI','DNR','MTX','TRZ','VEH'))) %>%
  mutate(time = rep((rep(c("3h", "24h"), c(6,6))), 6)) %>%
  mutate(time=factor(time,
                     levels=c("3h","24h"),
                     labels=c("3 hours","24 hours"))) %>%
  mutate(indv=factor(rep(c(1,2,3,4,5,6), c(12,12,12,12,12,12)))) %>%
  ggplot(., aes(x=drug, y=counts))+
  geom_boxplot(position="identity",aes(fill=drug))+
  geom_point(aes(col=indv, size=2, alpha=0.5))+
  guides(alpha= "none", size= "none",  indv="none")+
  scale_color_brewer(palette = "Dark2",guide = "none")+
  scale_fill_manual(values=drug_pal_fact)+
  facet_wrap("time", nrow=1, ncol=2)+
  theme_bw()+
  ylab(expression(atop("Early sustained response",italic("MEX3A")~log[2]~"cpm ")))+
  xlab("")+
  theme(strip.background = element_rect(fill = "#00BFC4"),
        plot.title = element_text(size=18,hjust = 0.5),
        axis.title = element_text(size = 15, color = "black"),
        axis.ticks = element_line(linewidth = 1.5),
        axis.line = element_line(linewidth = 1.5),
        axis.text.x = element_text(size = 12, color = "white", angle = 0),
        strip.text.x = element_text(size = 15, color = "black", face = "bold"))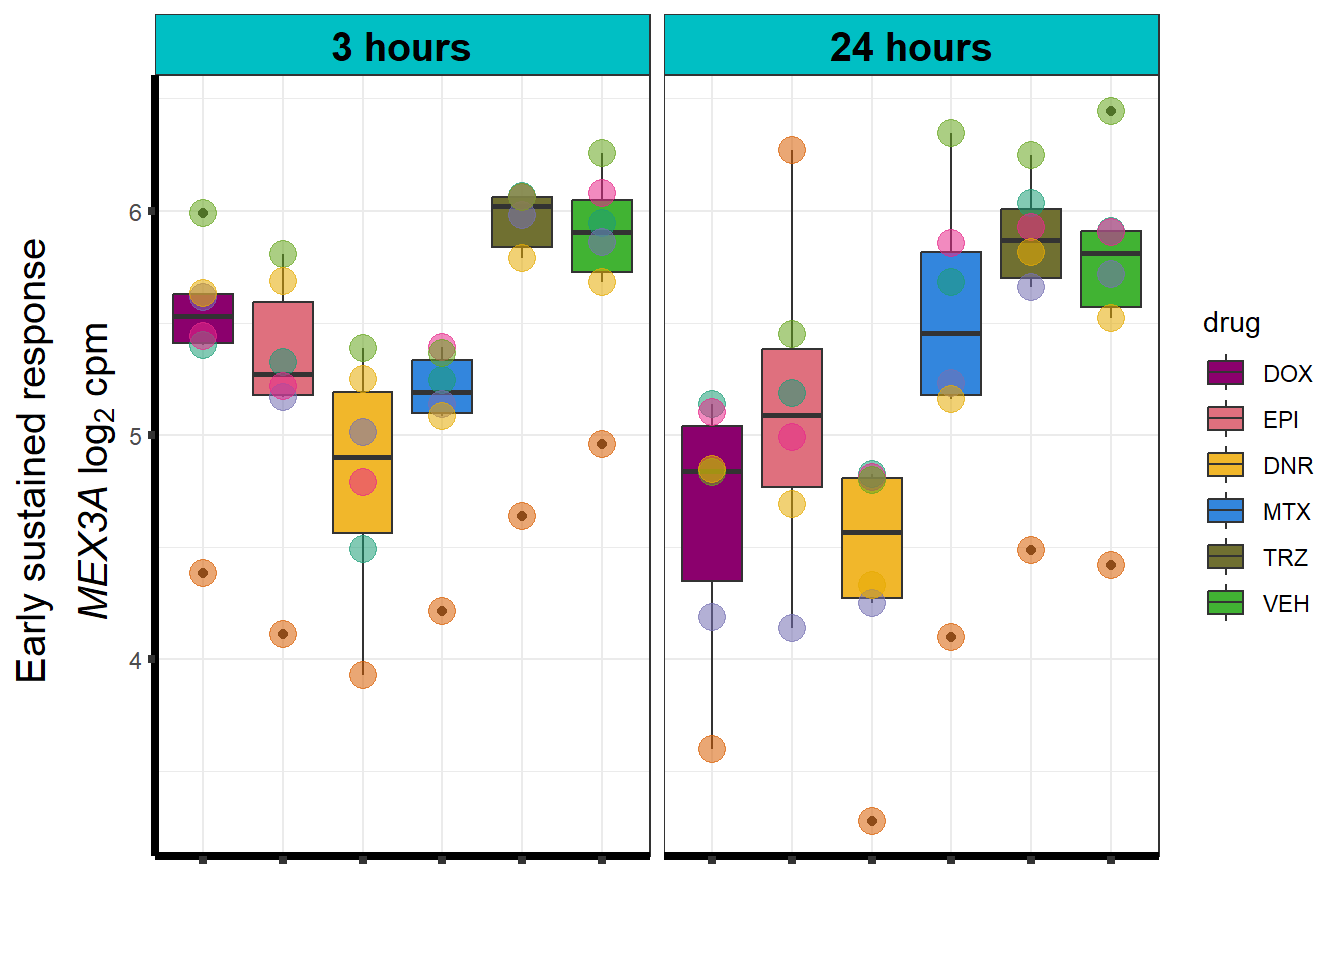
| Version | Author | Date |
|---|---|---|
| 45073b8 | reneeisnowhere | 2023-07-28 |
# saveRDS(motif_TI_rep,"output/motif_TI_rep.RDS")Log-Fold Change of TI response
lfc_nums %>%
  dplyr::filter(ENTREZID %in% clust2) %>%
  mutate(absFC=abs(logFC)) %>%
  mutate(id=factor(id, levels = c('DOX','EPI','DNR','MTX','TRZ','VEH'))) %>%
  mutate(time=factor(time,
                     levels=c("3_hours","24_hours"),
                     labels=c("3 hours","24 hours"))) %>%
  ggplot(., aes(x=id,y=absFC))+
  geom_boxplot(aes(fill=id))+
  scale_fill_manual(values=drug_pal_fact)+
  guides(fill=guide_legend(title = "Treatment"))+
  facet_wrap(~time)+
  theme_bw()+
  xlab("")+
  ylab("|Log Fold Change|")+
  theme_bw()+
  ggtitle("|Log Fold| for genes in ESR")+
  theme(plot.title = element_text(size = rel(1.5), hjust = 0.5),
        axis.title = element_text(size = 15, color = "black"),
        axis.line = element_line(linewidth = 1.5),
        strip.background = element_rect(fill = "#00BFC4"),
        axis.text = element_text(size = 8, color = "white", angle = 10),
        strip.text.x = element_text(size = 12, color = "black", face = "bold"))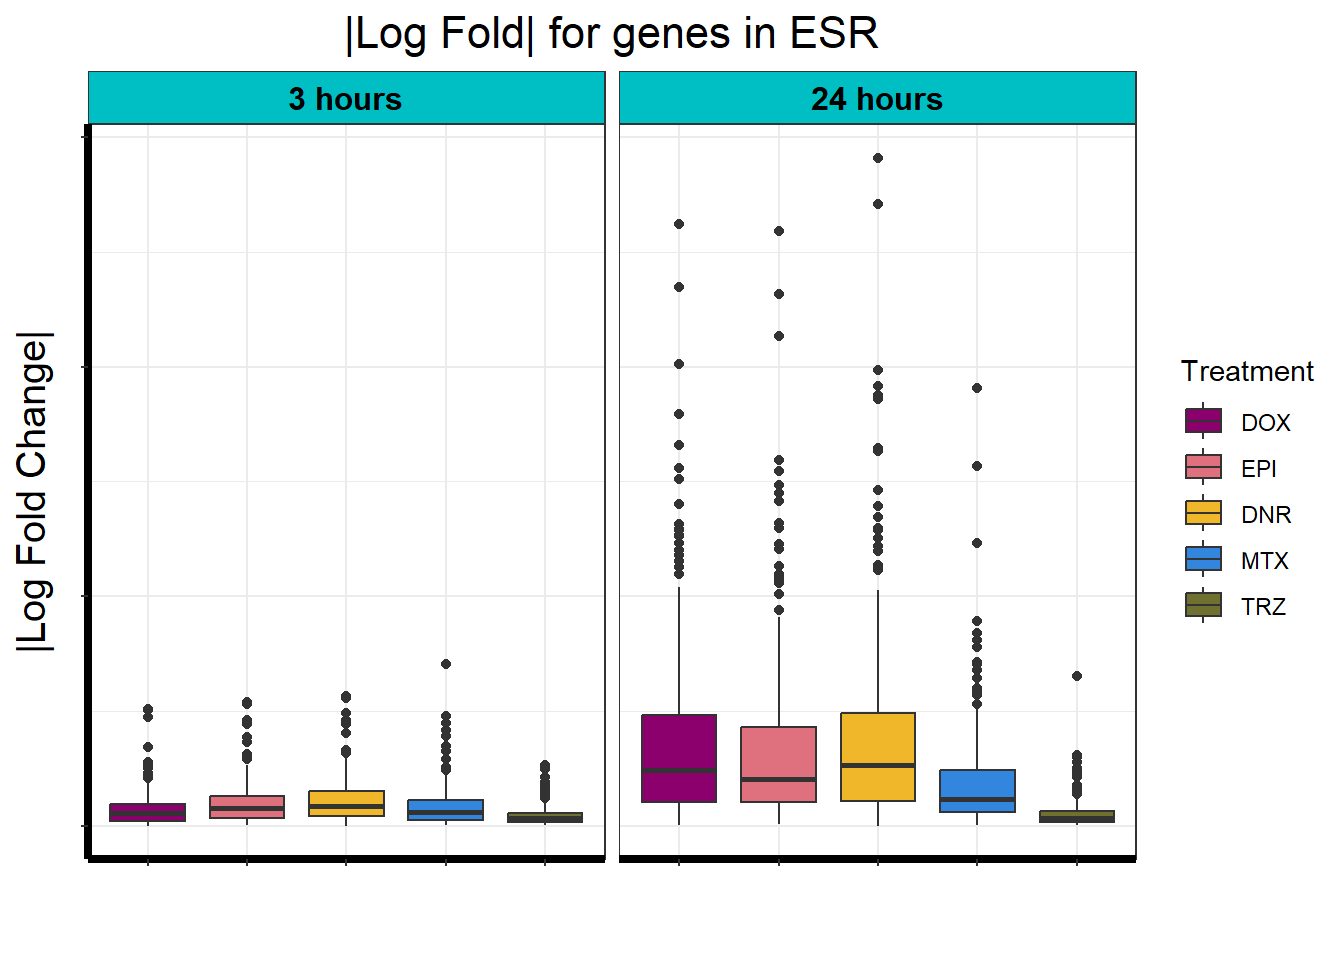
Motif_LR
# motif_LRrep <-
  cpmcounts %>% dplyr::filter(rownames(.)==55588) %>%
  pivot_longer(everything(), names_to = "treatment",values_to = "counts") %>%
  mutate(drug=rep(c("DNR","DOX","EPI","MTX","TRZ", "VEH"),12)) %>%
  mutate(drug=factor(drug, levels = c('DOX','EPI','DNR','MTX','TRZ','VEH'))) %>%
  mutate(time = rep((rep(c("3h", "24h"), c(6,6))), 6)) %>%
 mutate(time=factor(time, levels =c("3h", "24h"), labels=c("3 hours","24 hours"))) %>%
  mutate(indv=factor(rep(c(1,2,3,4,5,6), c(12,12,12,12,12,12)))) %>%
  ggplot(., aes(x=drug, y=counts))+
  geom_boxplot(position="identity",aes(fill=drug))+
  geom_point(aes(col=indv, size=2, alpha=0.5))+
  guides(alpha= "none", size= "none",  indv="none")+
  scale_color_brewer(palette = "Dark2",guide = "none")+
  scale_fill_manual(values=drug_pal_fact)+
  facet_wrap("time",  nrow=1, ncol=2)+
  theme_bw()+
  ylab(expression(atop("Late response ",italic("MED29")~log[2]~"cpm ")))+
  xlab("")+
  xlab("")+
  theme(strip.background = element_rect(fill = "#7CAE00"),
        plot.title = element_text(size=18,hjust = 0.5),
        axis.title = element_text(size = 15, color = "black"),
        axis.ticks = element_line(linewidth = 1.5),
        axis.line = element_line(linewidth = 1.5),
        axis.text.x = element_text(size = 12, color = "white", angle = 0),
        strip.text.x = element_text(size = 15, color = "black", face = "bold"))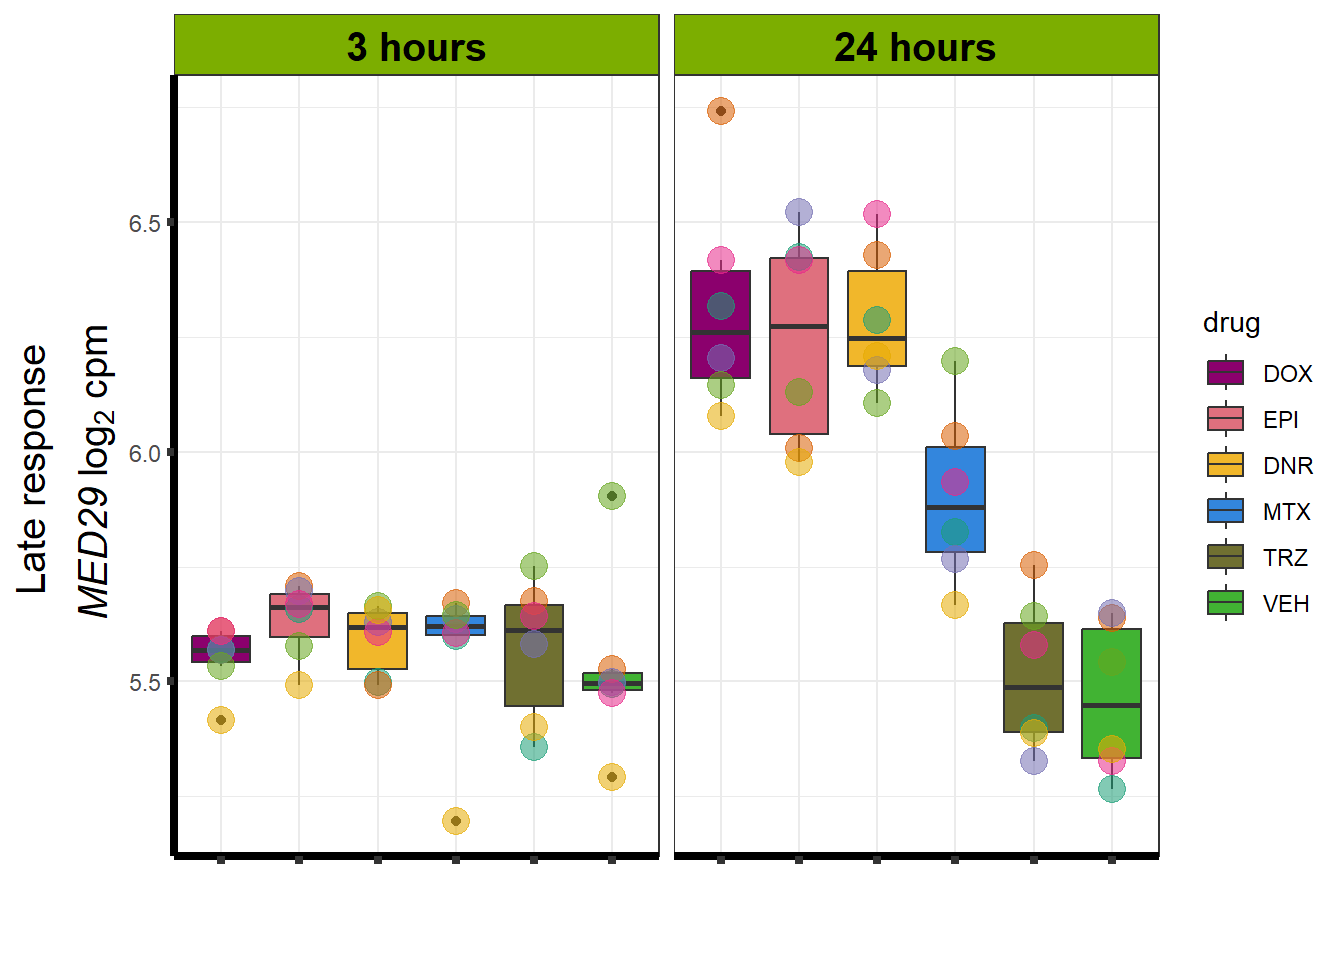
# saveRDS(motif_LRrep,"output/motif_LRrep.RDS")Log-Fold Change of Late Response
lfc_nums %>%
  dplyr::filter(ENTREZID %in% clust4) %>%
  mutate(absFC=abs(logFC)) %>%
  mutate(id = as.factor(id)) %>%
  mutate(time=factor(time, levels =c("3_hours", "24_hours"), labels=c("3 hours","24 hours"))) %>%
  ggplot(., aes(x=id,y=absFC))+
  geom_boxplot(aes(fill=id))+
  scale_fill_manual(values=drug_pal_fact)+
  guides(fill=guide_legend(title = "Treatment"))+
  facet_wrap(~time)+
  theme_bw()+
  xlab("")+
  ylab("|Log Fold Change|")+
  theme_bw()+
  ggtitle("|Log Fold| for genes in LR set")+
  theme(plot.title = element_text(size = rel(1.5), hjust = 0.5),
        axis.title = element_text(size = 15, color = "black"),
        axis.line = element_line(linewidth = 1.5),
        strip.background = element_rect(fill = "#7CAE00"),
        axis.text = element_text(size = 8, color = "white", angle = 10),
        strip.text.x = element_text(size = 12, color = "black", face = "bold"))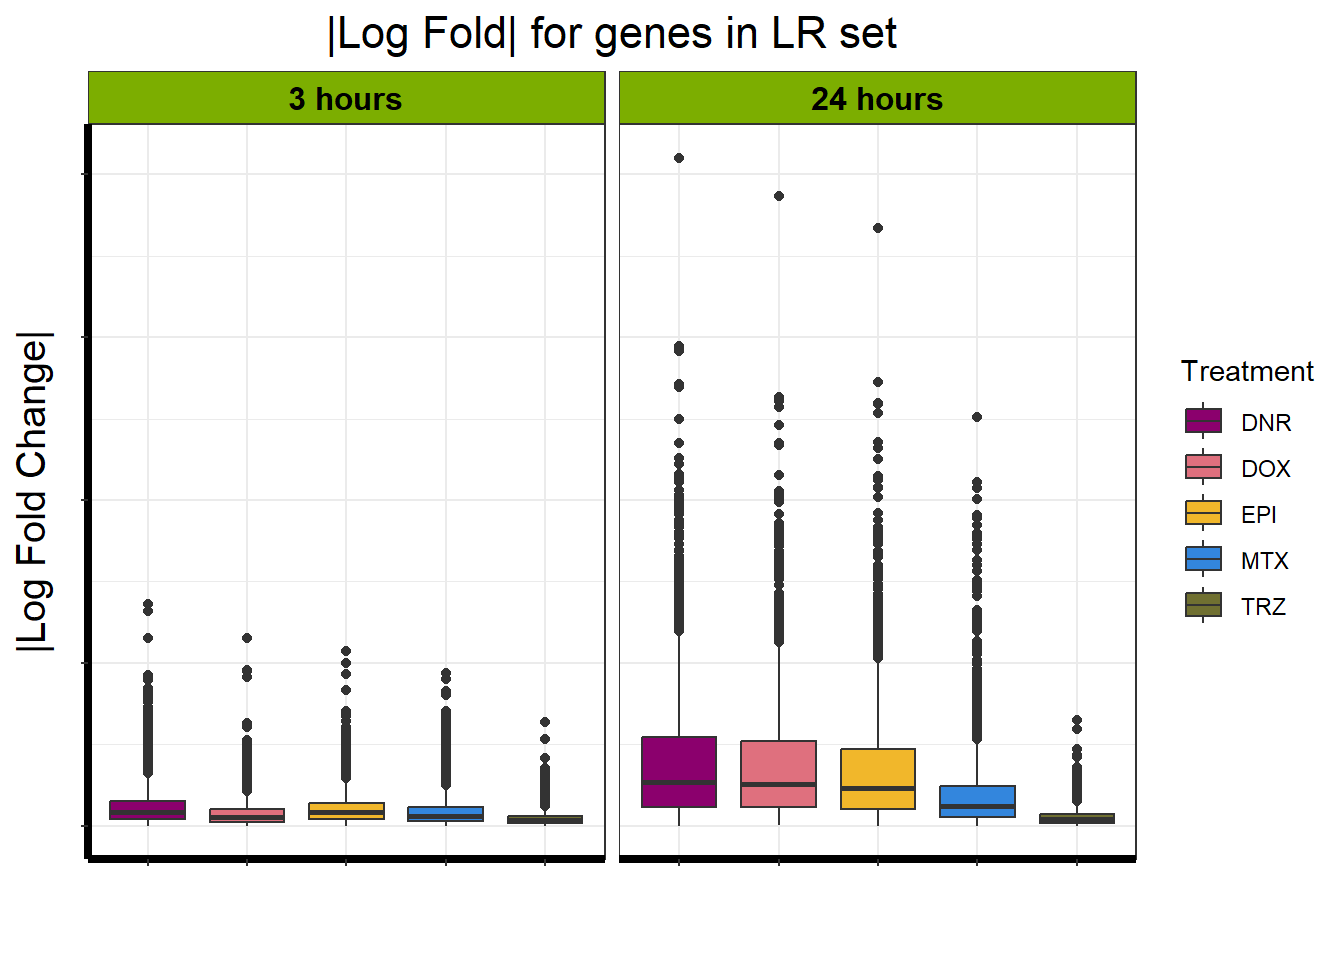
Motif_ER
# motif_ERrep <-
  cpmcounts %>% dplyr::filter(rownames(.)==27245) %>%
  pivot_longer(everything(), names_to = "treatment",values_to = "counts") %>%
  mutate(drug = rep(c("DNR","DOX","EPI","MTX","TRZ", "VEH"),12)) %>%
  mutate(time = rep((rep(c("3h", "24h"), c(6,6))), 6)) %>%
  mutate(time=factor(time, levels =c("3h", "24h"), labels=c("3 hours","24 hours"))) %>%
  mutate(indv=factor(rep(c(1,2,3,4,5,6), c(12,12,12,12,12,12)))) %>%
  ggplot(., aes(x=drug, y=counts))+
  geom_boxplot(position="identity",aes(fill=drug))+
  geom_point(aes(col=indv, size=2, alpha=0.5))+
  guides(alpha= "none", size= "none",  indv="none")+
  scale_color_brewer(palette = "Dark2",guide = "none")+
  scale_fill_manual(values=drug_pal_fact)+
  facet_wrap("time",nrow=1, ncol=2)+
  theme_bw()+
  ylab(expression(atop("Early acute response",italic("AHDC1")~log[2]~"cpm ")))+
  xlab("")+
  xlab("")+
  theme(strip.background = element_rect(fill = "#F8766D"),
        plot.title = element_text(size=18,hjust = 0.5),
        axis.title = element_text(size = 15, color = "black"),
        axis.ticks = element_line(linewidth = 1.5),
        axis.line = element_line(linewidth = 1.5),
        axis.text.x = element_text(size = 12, color = "white", angle = 0),
        strip.text.x = element_text(size = 15, color = "black", face = "bold"))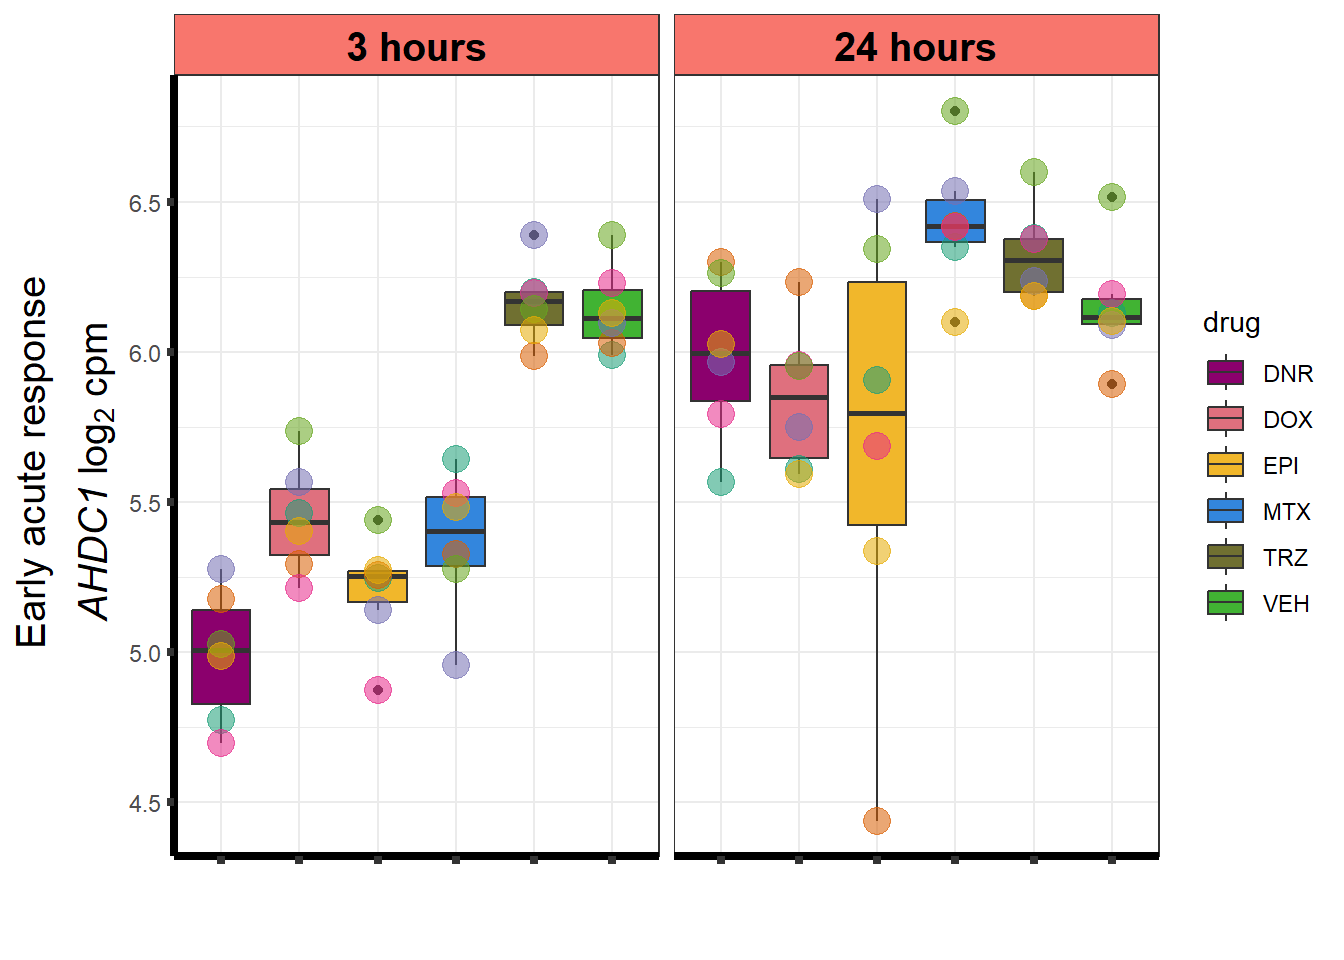
# saveRDS(motif_ERrep,"output/motif_ERrep.RDS")Log-Fold Change of Early Response
lfc_nums %>%
  dplyr::filter(ENTREZID %in% clust3) %>%
  mutate(absFC=abs(logFC)) %>%
  # mutate(id = as.factor(id)) %>%
  mutate(id=factor(id, levels = c('DOX','EPI','DNR','MTX','TRZ','VEH'))) %>%

  mutate(time=factor(time, levels=c("3_hours","24_hours"))) %>%
  ggplot(., aes(x=id,y=absFC))+
  geom_boxplot(aes(fill=id))+
  scale_fill_manual(values=drug_pal_fact)+
  guides(fill=guide_legend(title = "Treatment"))+
  facet_wrap(~time)+
  theme_bw()+
  xlab("")+
  ylab("|Log Fold Change|")+
  theme_bw()+
  ggtitle("|Log Fold| for genes in EAR set")+
  theme(plot.title = element_text(size = rel(1.5), hjust = 0.5),
        axis.title = element_text(size = 15, color = "black"),
        axis.line = element_line(linewidth = 1.5),
        strip.background = element_rect(fill = "#F8766D"),
        axis.text = element_text(size = 8, color = "white", angle = 10),
        strip.text.x = element_text(size = 12, color = "black", face = "bold"))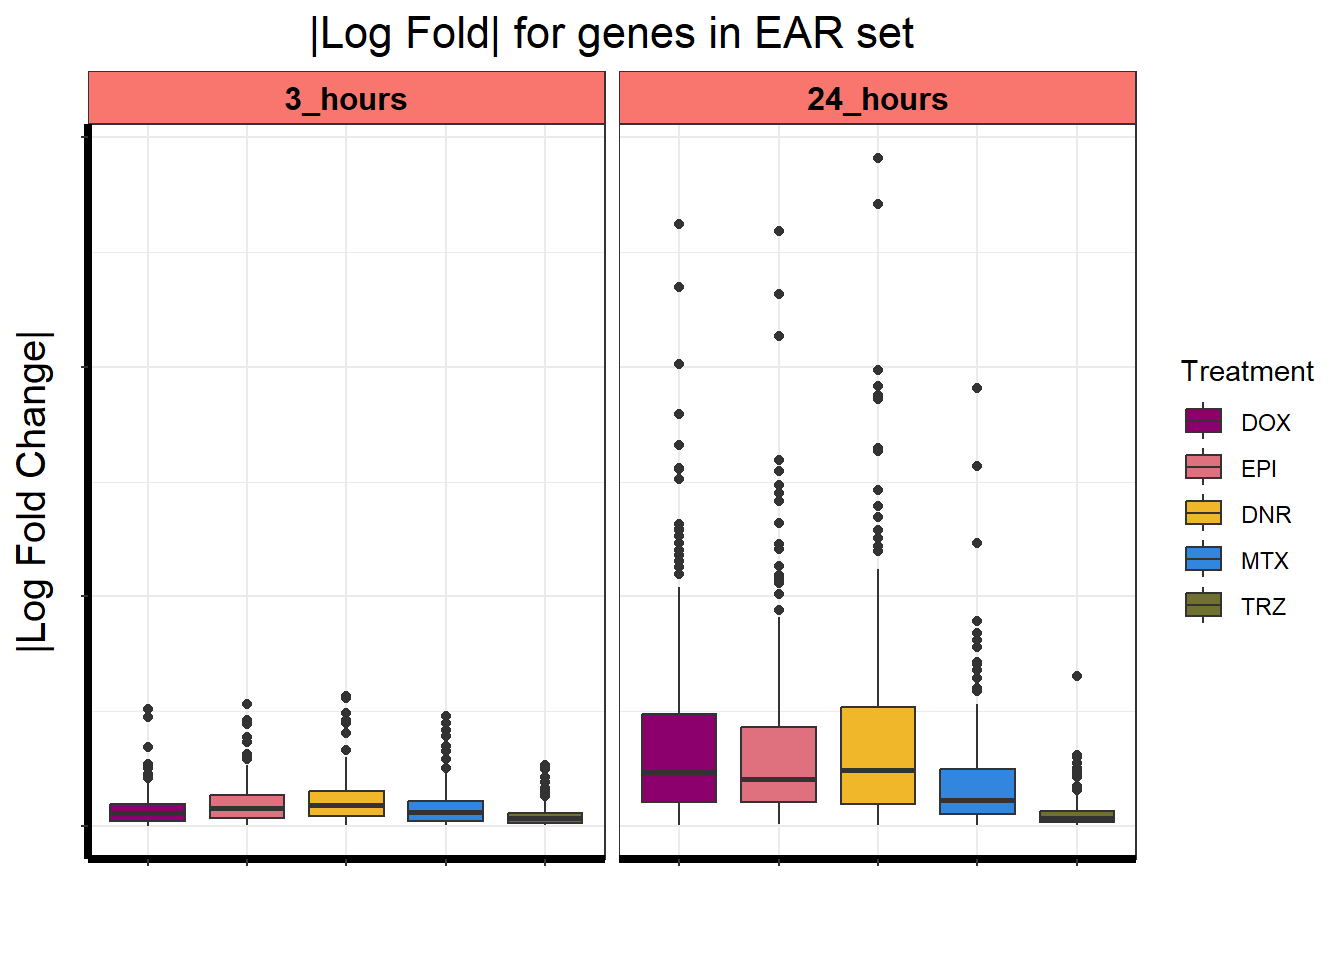
##  I want the mean lfc by cluster with sid deg and non sid deg at 3 and 24 hourslfc_nums %>%

mean_lfc <- lfc_nums %>%
  mutate(ER=if_else(ENTREZID %in%motif_ER,"y","no")) %>%
  mutate(LR=if_else(ENTREZID %in%motif_LR,"y","no")) %>%
  mutate(TI=if_else(ENTREZID %in%motif_TI,"y","no")) %>%
  mutate(NR=if_else(ENTREZID %in%motif_NR,"y","no")) %>%
  mutate(id = as.factor(id)) %>%
  mutate(time=factor(time, levels=c("3_hours","24_hours"))) %>%
  group_by(id,time) %>%
  mutate(absFC=abs(logFC)) %>%
  dplyr::select(id,time,absFC,ER,TI,LR,NR) %>%
  dplyr::summarize(EAR=mean(absFC[ER=="y"]),ESR=mean(absFC[TI=="y"]),LR=mean(absFC[LR=="y"]),NR=mean(absFC[NR=="y"])) %>% as.data.frame()


mean_lfc %>%
    mutate(time=factor(time,
                     levels=c("3_hours","24_hours"),
                     labels=c("3 hours","24 hours"))) %>%
  mutate(id=factor(id, levels=c("DNR" ,"DOX", "EPI" , "MTX" ,"TRZ"))) %>%
  pivot_longer(!c(id,time), names_to = "Motif",values_to="meanLFC") %>%
  ggplot(., aes(x=time,y= meanLFC,col=id,group=id))+
  geom_point()+
  geom_line(size = 3)+
 scale_fill_manual(values=drug_pal_fact)+
  facet_wrap(~Motif)+
  theme_bw()+
  xlab("")+
  scale_color_manual(values=drug_pal_fact)+
  ylab("|Log Fold Change|")+
  theme_bw()+
  ggtitle(" average |Log Fold| for genes across treatment each motif")+
  theme(plot.title = element_text(size = rel(1.5), hjust = 0.5),
        axis.title = element_text(size = 15, color = "black"),
        axis.line = element_line(linewidth = 1.5),
        strip.background = element_rect(fill = "transparent"),
        axis.text = element_text(size = 8, color = "black", angle = 0),
        strip.text.x = element_text(size = 12, color = "black", face = "bold"))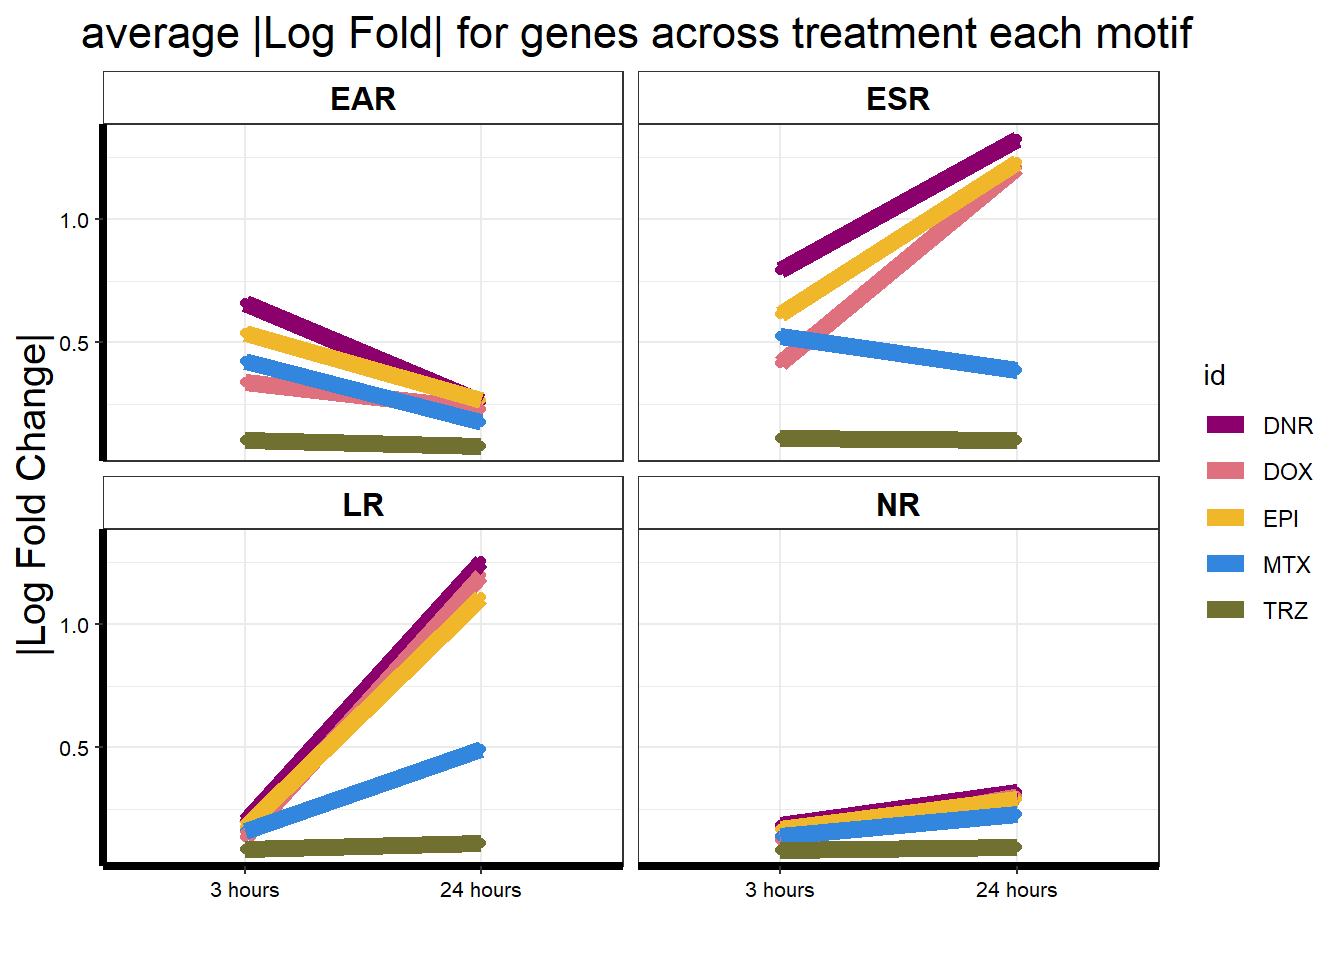
| Version | Author | Date |
|---|---|---|
| 3511b8e | reneeisnowhere | 2023-09-25 |
sessionInfo()R version 4.3.1 (2023-06-16 ucrt)
Platform: x86_64-w64-mingw32/x64 (64-bit)
Running under: Windows 10 x64 (build 19045)
Matrix products: default
locale:
[1] LC_COLLATE=English_United States.utf8
[2] LC_CTYPE=English_United States.utf8
[3] LC_MONETARY=English_United States.utf8
[4] LC_NUMERIC=C
[5] LC_TIME=English_United States.utf8
time zone: America/Chicago
tzcode source: internal
attached base packages:
[1] grid stats graphics grDevices utils datasets methods
[8] base
other attached packages:
[1] ggpubr_0.6.0 RColorBrewer_1.1-3 Cormotif_1.46.0
[4] limma_3.56.2 affy_1.78.2 Biobase_2.60.0
[7] ggVennDiagram_1.2.3 scales_1.2.1 kableExtra_1.3.4
[10] VennDiagram_1.7.3 futile.logger_1.4.3 gridExtra_2.3
[13] BiocGenerics_0.46.0 gprofiler2_0.2.2 lubridate_1.9.3
[16] forcats_1.0.0 stringr_1.5.0 dplyr_1.1.3
[19] purrr_1.0.2 readr_2.1.4 tidyr_1.3.0
[22] tibble_3.2.1 ggplot2_3.4.4 tidyverse_2.0.0
[25] workflowr_1.7.1
loaded via a namespace (and not attached):
[1] formatR_1.14 rlang_1.1.1 magrittr_2.0.3
[4] git2r_0.32.0 compiler_4.3.1 getPass_0.2-2
[7] systemfonts_1.0.5 callr_3.7.3 vctrs_0.6.4
[10] rvest_1.0.3 pkgconfig_2.0.3 fastmap_1.1.1
[13] ellipsis_0.3.2 backports_1.4.1 labeling_0.4.3
[16] utf8_1.2.3 promises_1.2.1 rmarkdown_2.25
[19] tzdb_0.4.0 ps_1.7.5 preprocessCore_1.62.1
[22] xfun_0.40 zlibbioc_1.46.0 cachem_1.0.8
[25] jsonlite_1.8.7 RVenn_1.1.0 highr_0.10
[28] later_1.3.1 broom_1.0.5 R6_2.5.1
[31] bslib_0.5.1 stringi_1.7.12 car_3.1-2
[34] jquerylib_0.1.4 Rcpp_1.0.11 knitr_1.44
[37] httpuv_1.6.11 timechange_0.2.0 tidyselect_1.2.0
[40] rstudioapi_0.15.0 abind_1.4-5 yaml_2.3.7
[43] processx_3.8.2 shiny_1.7.5.1 withr_2.5.1
[46] evaluate_0.22 lambda.r_1.2.4 xml2_1.3.5
[49] pillar_1.9.0 affyio_1.70.0 BiocManager_1.30.22
[52] carData_3.0-5 whisker_0.4.1 plotly_4.10.3
[55] generics_0.1.3 rprojroot_2.0.3 hms_1.1.3
[58] munsell_0.5.0 xtable_1.8-4 glue_1.6.2
[61] lazyeval_0.2.2 tools_4.3.1 data.table_1.14.8
[64] webshot_0.5.5 ggsignif_0.6.4 fs_1.6.3
[67] crosstalk_1.2.0 colorspace_2.1-0 cli_3.6.1
[70] futile.options_1.0.1 fansi_1.0.5 viridisLite_0.4.2
[73] svglite_2.1.2 gtable_0.3.4 rstatix_0.7.2
[76] sass_0.4.7 digest_0.6.33 htmlwidgets_1.6.2
[79] farver_2.1.1 htmltools_0.5.6.1 lifecycle_1.0.3
[82] httr_1.4.7 mime_0.12