TE_analysis_DOX_DAR
Renee Matthews
2025-06-05
Last updated: 2025-07-29
Checks: 7 0
Knit directory: ATAC_learning/
This reproducible R Markdown analysis was created with workflowr (version 1.7.1). The Checks tab describes the reproducibility checks that were applied when the results were created. The Past versions tab lists the development history.
Great! Since the R Markdown file has been committed to the Git repository, you know the exact version of the code that produced these results.
Great job! The global environment was empty. Objects defined in the global environment can affect the analysis in your R Markdown file in unknown ways. For reproduciblity it’s best to always run the code in an empty environment.
The command set.seed(20231016) was run prior to running
the code in the R Markdown file. Setting a seed ensures that any results
that rely on randomness, e.g. subsampling or permutations, are
reproducible.
Great job! Recording the operating system, R version, and package versions is critical for reproducibility.
Nice! There were no cached chunks for this analysis, so you can be confident that you successfully produced the results during this run.
Great job! Using relative paths to the files within your workflowr project makes it easier to run your code on other machines.
Great! You are using Git for version control. Tracking code development and connecting the code version to the results is critical for reproducibility.
The results in this page were generated with repository version 73e2e37. See the Past versions tab to see a history of the changes made to the R Markdown and HTML files.
Note that you need to be careful to ensure that all relevant files for
the analysis have been committed to Git prior to generating the results
(you can use wflow_publish or
wflow_git_commit). workflowr only checks the R Markdown
file, but you know if there are other scripts or data files that it
depends on. Below is the status of the Git repository when the results
were generated:
Ignored files:
    Ignored:    .RData
    Ignored:    .Rhistory
    Ignored:    .Rproj.user/
    Ignored:    analysis/H3K27ac_integration_noM.Rmd
    Ignored:    data/ACresp_SNP_table.csv
    Ignored:    data/ARR_SNP_table.csv
    Ignored:    data/All_merged_peaks.tsv
    Ignored:    data/CAD_gwas_dataframe.RDS
    Ignored:    data/CTX_SNP_table.csv
    Ignored:    data/Collapsed_expressed_NG_peak_table.csv
    Ignored:    data/DEG_toplist_sep_n45.RDS
    Ignored:    data/FRiP_first_run.txt
    Ignored:    data/Final_four_data/
    Ignored:    data/Frip_1_reads.csv
    Ignored:    data/Frip_2_reads.csv
    Ignored:    data/Frip_3_reads.csv
    Ignored:    data/Frip_4_reads.csv
    Ignored:    data/Frip_5_reads.csv
    Ignored:    data/Frip_6_reads.csv
    Ignored:    data/GO_KEGG_analysis/
    Ignored:    data/HF_SNP_table.csv
    Ignored:    data/Ind1_75DA24h_dedup_peaks.csv
    Ignored:    data/Ind1_TSS_peaks.RDS
    Ignored:    data/Ind1_firstfragment_files.txt
    Ignored:    data/Ind1_fragment_files.txt
    Ignored:    data/Ind1_peaks_list.RDS
    Ignored:    data/Ind1_summary.txt
    Ignored:    data/Ind2_TSS_peaks.RDS
    Ignored:    data/Ind2_fragment_files.txt
    Ignored:    data/Ind2_peaks_list.RDS
    Ignored:    data/Ind2_summary.txt
    Ignored:    data/Ind3_TSS_peaks.RDS
    Ignored:    data/Ind3_fragment_files.txt
    Ignored:    data/Ind3_peaks_list.RDS
    Ignored:    data/Ind3_summary.txt
    Ignored:    data/Ind4_79B24h_dedup_peaks.csv
    Ignored:    data/Ind4_TSS_peaks.RDS
    Ignored:    data/Ind4_V24h_fraglength.txt
    Ignored:    data/Ind4_fragment_files.txt
    Ignored:    data/Ind4_fragment_filesN.txt
    Ignored:    data/Ind4_peaks_list.RDS
    Ignored:    data/Ind4_summary.txt
    Ignored:    data/Ind5_TSS_peaks.RDS
    Ignored:    data/Ind5_fragment_files.txt
    Ignored:    data/Ind5_fragment_filesN.txt
    Ignored:    data/Ind5_peaks_list.RDS
    Ignored:    data/Ind5_summary.txt
    Ignored:    data/Ind6_TSS_peaks.RDS
    Ignored:    data/Ind6_fragment_files.txt
    Ignored:    data/Ind6_peaks_list.RDS
    Ignored:    data/Ind6_summary.txt
    Ignored:    data/Knowles_4.RDS
    Ignored:    data/Knowles_5.RDS
    Ignored:    data/Knowles_6.RDS
    Ignored:    data/LiSiLTDNRe_TE_df.RDS
    Ignored:    data/MI_gwas.RDS
    Ignored:    data/SNP_GWAS_PEAK_MRC_id
    Ignored:    data/SNP_GWAS_PEAK_MRC_id.csv
    Ignored:    data/SNP_gene_cat_list.tsv
    Ignored:    data/SNP_supp_schneider.RDS
    Ignored:    data/TE_info/
    Ignored:    data/TFmapnames.RDS
    Ignored:    data/all_TSSE_scores.RDS
    Ignored:    data/all_four_filtered_counts.txt
    Ignored:    data/aln_run1_results.txt
    Ignored:    data/anno_ind1_DA24h.RDS
    Ignored:    data/anno_ind4_V24h.RDS
    Ignored:    data/annotated_gwas_SNPS.csv
    Ignored:    data/background_n45_he_peaks.RDS
    Ignored:    data/cardiac_muscle_FRIP.csv
    Ignored:    data/cardiomyocyte_FRIP.csv
    Ignored:    data/col_ng_peak.csv
    Ignored:    data/cormotif_full_4_run.RDS
    Ignored:    data/cormotif_full_4_run_he.RDS
    Ignored:    data/cormotif_full_6_run.RDS
    Ignored:    data/cormotif_full_6_run_he.RDS
    Ignored:    data/cormotif_probability_45_list.csv
    Ignored:    data/cormotif_probability_45_list_he.csv
    Ignored:    data/cormotif_probability_all_6_list.csv
    Ignored:    data/cormotif_probability_all_6_list_he.csv
    Ignored:    data/datasave.RDS
    Ignored:    data/embryo_heart_FRIP.csv
    Ignored:    data/enhancer_list_ENCFF126UHK.bed
    Ignored:    data/enhancerdata/
    Ignored:    data/filt_Peaks_efit2.RDS
    Ignored:    data/filt_Peaks_efit2_bl.RDS
    Ignored:    data/filt_Peaks_efit2_n45.RDS
    Ignored:    data/first_Peaksummarycounts.csv
    Ignored:    data/first_run_frag_counts.txt
    Ignored:    data/full_bedfiles/
    Ignored:    data/gene_ref.csv
    Ignored:    data/gwas_1_dataframe.RDS
    Ignored:    data/gwas_2_dataframe.RDS
    Ignored:    data/gwas_3_dataframe.RDS
    Ignored:    data/gwas_4_dataframe.RDS
    Ignored:    data/gwas_5_dataframe.RDS
    Ignored:    data/high_conf_peak_counts.csv
    Ignored:    data/high_conf_peak_counts.txt
    Ignored:    data/high_conf_peaks_bl_counts.txt
    Ignored:    data/high_conf_peaks_counts.txt
    Ignored:    data/hits_files/
    Ignored:    data/hyper_files/
    Ignored:    data/hypo_files/
    Ignored:    data/ind1_DA24hpeaks.RDS
    Ignored:    data/ind1_TSSE.RDS
    Ignored:    data/ind2_TSSE.RDS
    Ignored:    data/ind3_TSSE.RDS
    Ignored:    data/ind4_TSSE.RDS
    Ignored:    data/ind4_V24hpeaks.RDS
    Ignored:    data/ind5_TSSE.RDS
    Ignored:    data/ind6_TSSE.RDS
    Ignored:    data/initial_complete_stats_run1.txt
    Ignored:    data/left_ventricle_FRIP.csv
    Ignored:    data/median_24_lfc.RDS
    Ignored:    data/median_3_lfc.RDS
    Ignored:    data/mergedPeads.gff
    Ignored:    data/mergedPeaks.gff
    Ignored:    data/motif_list_full
    Ignored:    data/motif_list_n45
    Ignored:    data/motif_list_n45.RDS
    Ignored:    data/multiqc_fastqc_run1.txt
    Ignored:    data/multiqc_fastqc_run2.txt
    Ignored:    data/multiqc_genestat_run1.txt
    Ignored:    data/multiqc_genestat_run2.txt
    Ignored:    data/my_hc_filt_counts.RDS
    Ignored:    data/my_hc_filt_counts_n45.RDS
    Ignored:    data/n45_bedfiles/
    Ignored:    data/n45_files
    Ignored:    data/other_papers/
    Ignored:    data/peakAnnoList_1.RDS
    Ignored:    data/peakAnnoList_2.RDS
    Ignored:    data/peakAnnoList_24_full.RDS
    Ignored:    data/peakAnnoList_24_n45.RDS
    Ignored:    data/peakAnnoList_3.RDS
    Ignored:    data/peakAnnoList_3_full.RDS
    Ignored:    data/peakAnnoList_3_n45.RDS
    Ignored:    data/peakAnnoList_4.RDS
    Ignored:    data/peakAnnoList_5.RDS
    Ignored:    data/peakAnnoList_6.RDS
    Ignored:    data/peakAnnoList_Eight.RDS
    Ignored:    data/peakAnnoList_full_motif.RDS
    Ignored:    data/peakAnnoList_n45_motif.RDS
    Ignored:    data/siglist_full.RDS
    Ignored:    data/siglist_n45.RDS
    Ignored:    data/summarized_peaks_dataframe.txt
    Ignored:    data/summary_peakIDandReHeat.csv
    Ignored:    data/test.list.RDS
    Ignored:    data/testnames.txt
    Ignored:    data/toplist_6.RDS
    Ignored:    data/toplist_full.RDS
    Ignored:    data/toplist_full_DAR_6.RDS
    Ignored:    data/toplist_n45.RDS
    Ignored:    data/trimmed_seq_length.csv
    Ignored:    data/unclassified_full_set_peaks.RDS
    Ignored:    data/unclassified_n45_set_peaks.RDS
    Ignored:    data/xstreme/

Untracked files:
    Untracked:  RNA_seq_integration.Rmd
    Untracked:  Rplot.pdf
    Untracked:  Sig_meta
    Untracked:  analysis/.gitignore
    Untracked:  analysis/Cormotif_analysis_testing diff.Rmd
    Untracked:  analysis/Diagnosis-tmm.Rmd
    Untracked:  analysis/Expressed_RNA_associations.Rmd
    Untracked:  analysis/LFC_corr.Rmd
    Untracked:  analysis/SVA.Rmd
    Untracked:  analysis/Tan2020.Rmd
    Untracked:  analysis/making_master_peaks_list.Rmd
    Untracked:  analysis/my_hc_filt_counts.csv
    Untracked:  code/Concatenations_for_export.R
    Untracked:  code/IGV_snapshot_code.R
    Untracked:  code/LongDARlist.R
    Untracked:  code/just_for_Fun.R
    Untracked:  my_plot.pdf
    Untracked:  my_plot.png
    Untracked:  output/cormotif_probability_45_list.csv
    Untracked:  output/cormotif_probability_all_6_list.csv
    Untracked:  setup.RData

Unstaged changes:
    Modified:   ATAC_learning.Rproj
    Modified:   analysis/AC_shared_analysis.Rmd
    Modified:   analysis/AF_HF_SNP_DAR.Rmd
    Modified:   analysis/AF_HF_SNPs.Rmd
    Modified:   analysis/Cardiotox_SNPs.Rmd
    Modified:   analysis/Cormotif_analysis.Rmd
    Modified:   analysis/DEG_analysis.Rmd
    Modified:   analysis/H3K27ac_initial_QC.Rmd
    Modified:   analysis/H3K27ac_integration.Rmd
    Modified:   analysis/Jaspar_motif.Rmd
    Modified:   analysis/Jaspar_motif_ff.Rmd
    Modified:   analysis/SNP_TAD_peaks.Rmd
    Modified:   analysis/TE_analysis_norm.Rmd
    Modified:   analysis/Top2B_analysis.Rmd
    Modified:   analysis/final_four_analysis.Rmd
Note that any generated files, e.g. HTML, png, CSS, etc., are not included in this status report because it is ok for generated content to have uncommitted changes.
These are the previous versions of the repository in which changes were
made to the R Markdown (analysis/TE_analysis_ALL_DAR.Rmd)
and HTML (docs/TE_analysis_ALL_DAR.html) files. If you’ve
configured a remote Git repository (see ?wflow_git_remote),
click on the hyperlinks in the table below to view the files as they
were in that past version.
| File | Version | Author | Date | Message |
|---|---|---|---|---|
| Rmd | 73e2e37 | reneeisnowhere | 2025-07-29 | or updates |
| html | e7c389e | reneeisnowhere | 2025-07-23 | Build site. |
| Rmd | 5aad4a4 | reneeisnowhere | 2025-07-23 | wflow_publish("analysis/TE_analysis_ALL_DAR.Rmd") |
| html | 581563e | reneeisnowhere | 2025-06-18 | Build site. |
| Rmd | c78c973 | reneeisnowhere | 2025-06-18 | updates using all trts |
| html | af91ecf | reneeisnowhere | 2025-06-18 | Build site. |
| Rmd | 62bafc3 | reneeisnowhere | 2025-06-18 | adding all trts |
library(tidyverse)
library(kableExtra)
library(broom)
library(RColorBrewer)
library(ChIPseeker)
library("TxDb.Hsapiens.UCSC.hg38.knownGene")
library("org.Hs.eg.db")
library(rtracklayer)
library(edgeR)
library(ggfortify)
library(limma)
library(readr)
library(BiocGenerics)
library(gridExtra)
library(VennDiagram)
library(scales)
library(BiocParallel)
library(ggpubr)
library(devtools)
library(biomaRt)
library(eulerr)
library(smplot2)
library(genomation)
library(ggsignif)
library(plyranges)
library(ggrepel)
library(epitools)
library(circlize)
Loading repeatmasker data:
repeatmasker <- read.delim("data/other_papers/repeatmasker.tsv")Subsetting repeatmasker for analysis by class/family
reClass_list <- repeatmasker %>%
  distinct(repClass)

Line_repeats <- repeatmasker %>%
  dplyr::filter(repClass == "LINE") %>%
 makeGRangesFromDataFrame(., keep.extra.columns = TRUE, seqnames.field = "genoName", start.field = "genoStart", end.field = "genoEnd",starts.in.df.are.0based=TRUE)

Sine_repeats <- repeatmasker %>%
  dplyr::filter(repClass == "SINE") %>%
 makeGRangesFromDataFrame(., keep.extra.columns = TRUE, seqnames.field = "genoName", start.field = "genoStart", end.field = "genoEnd",starts.in.df.are.0based=TRUE)

LTR_repeats <- repeatmasker %>%
  dplyr::filter(repClass == "LTR") %>%
 makeGRangesFromDataFrame(., keep.extra.columns = TRUE, seqnames.field = "genoName", start.field = "genoStart", end.field = "genoEnd",starts.in.df.are.0based=TRUE)

DNA_repeats <- repeatmasker %>%
  dplyr::filter(repClass == "DNA") %>%
 makeGRangesFromDataFrame(., keep.extra.columns = TRUE, seqnames.field = "genoName", start.field = "genoStart", end.field = "genoEnd",starts.in.df.are.0based=TRUE)

retroposon_repeats <- repeatmasker %>%
  dplyr::filter(repClass == "Retroposon") %>%
 makeGRangesFromDataFrame(., keep.extra.columns = TRUE, seqnames.field = "genoName", start.field = "genoStart", end.field = "genoEnd",starts.in.df.are.0based=TRUE)

all_TEs_gr <- repeatmasker %>%
 makeGRangesFromDataFrame(., keep.extra.columns = TRUE, seqnames.field = "genoName", start.field = "genoStart", end.field = "genoEnd",starts.in.df.are.0based=TRUE)
Initial overlaps of TEs vs all regions (155,557)
toptable_results <- readRDS("data/Final_four_data/re_analysis/Toptable_results.RDS")
all_regions <- toptable_results$DOX_24$genes

Collapsed_peaks <- read_delim("data/Final_four_data/collapsed_new_peaks.txt",
                              delim = "\t",
                              escape_double = FALSE,
                              trim_ws = TRUE)

Col_TSS_data_gr <- Collapsed_peaks %>%
  dplyr::filter(chr != "chrY") %>%
  dplyr::filter(Peakid %in% all_regions) %>%
  GRanges()

all_results  <- toptable_results %>%
  imap(~ .x %>% tibble::rownames_to_column(var = "rowname") %>%
         mutate(source = .y)) %>%
  bind_rows()

my_DOX_data <- all_results %>%
  dplyr::filter(source=="DOX_3"|source=="DOX_24") %>%
  dplyr::select(source,genes,logFC,adj.P.Val) %>%
  pivot_wider(.,id_cols=genes,names_from = source, values_from = c(logFC, adj.P.Val))

my_EPI_data <- all_results %>%
  dplyr::filter(source=="EPI_3"|source=="EPI_24") %>%
  dplyr::select(source,genes,logFC,adj.P.Val) %>%
  pivot_wider(.,id_cols=genes,names_from = source, values_from = c(logFC, adj.P.Val))

my_DNR_data <- all_results %>%
  dplyr::filter(source=="DNR_3"|source=="DNR_24") %>%
  dplyr::select(source,genes,logFC,adj.P.Val) %>%
  pivot_wider(.,id_cols=genes,names_from = source, values_from = c(logFC, adj.P.Val))

my_MTX_data <- all_results %>%
  dplyr::filter(source=="MTX_3"|source=="MTX_24") %>%
  dplyr::select(source,genes,logFC,adj.P.Val) %>%
  pivot_wider(.,id_cols=genes,names_from = source, values_from = c(logFC, adj.P.Val))
Overlapping all peaks with TEs
overlap_TE_gr <- join_overlap_intersect(Col_TSS_data_gr,all_TEs_gr)
TE_peaks <- overlap_TE_gr %>%
  as.data.frame() %>%
  distinct(Peakid)

LINE_peaks <- overlap_TE_gr %>%
  as.data.frame() %>%
  dplyr::filter(repClass=="LINE") %>%
  distinct(Peakid)

SINE_peaks <- overlap_TE_gr %>%
  as.data.frame() %>%
  dplyr::filter(repClass=="SINE") %>%
  distinct(Peakid)

LTR_peaks <- overlap_TE_gr %>%
  as.data.frame() %>%
  dplyr::filter(repClass=="LTR") %>%
  distinct(Peakid)

DNA_peaks <- overlap_TE_gr %>%
  as.data.frame() %>%
  dplyr::filter(repClass=="DNA") %>%
  distinct(Peakid)

SVA_peaks <- overlap_TE_gr %>%
  as.data.frame() %>%
  dplyr::filter(repClass=="Retroposon") %>%
  distinct(Peakid)

# join sig data by toptable information

all_results  <- toptable_results %>%
  imap(~ .x %>% tibble::rownames_to_column(var = "rowname") %>%
         mutate(source = .y)) %>%
  bind_rows()

annotated_peaks <-   all_results %>%
  dplyr::filter(source=="DOX_3"|source=="DOX_24") %>%
  dplyr::select(source,genes,logFC,adj.P.Val) %>%
  pivot_wider(.,id_cols=genes,names_from = source, values_from = c(logFC, adj.P.Val)) %>%
  mutate(TE_status=if_else(genes %in% TE_peaks$Peakid,"TE_peak","not_TE_peak"),
         LINE_status=if_else(genes %in% LINE_peaks$Peakid,"LINE_peak","not_LINE_peak"),
         SINE_status=if_else(genes %in% SINE_peaks$Peakid,"SINE_peak","not_SINE_peak"),
         LTR_status=if_else(genes %in% LTR_peaks$Peakid,"LTR_peak","not_LTR_peak"),
         DNA_status=if_else(genes %in% DNA_peaks$Peakid,"DNA_peak","not_DNA_peak"),
         SVA_status=if_else(genes %in% SVA_peaks$Peakid,"SVA_peak","not_SVA_peak")) %>%
  mutate(DOX_sig_3=if_else(adj.P.Val_DOX_3<0.05,"sig","not_sig"),
         DOX_sig_24=if_else(adj.P.Val_DOX_24<0.05,"sig","not_sig")) %>%
  mutate(DOX_sig_3=factor(DOX_sig_3,levels=c("sig","not_sig")),
         DOX_sig_24=factor(DOX_sig_24,levels=c("sig","not_sig"))) %>%
  left_join(.,my_EPI_data,by=c("genes"="genes")) %>%
  mutate(EPI_sig_3=if_else(adj.P.Val_EPI_3<0.05,"sig","not_sig"),
         EPI_sig_24=if_else(adj.P.Val_EPI_24<0.05,"sig","not_sig")) %>%
  mutate(EPI_sig_3=factor(EPI_sig_3,levels=c("sig","not_sig")),
         EPI_sig_24=factor(EPI_sig_24,levels=c("sig","not_sig"))) %>%
  left_join(.,my_DNR_data,by=c("genes"="genes")) %>%
  mutate(DNR_sig_3=if_else(adj.P.Val_DNR_3<0.05,"sig","not_sig"),
         DNR_sig_24=if_else(adj.P.Val_DNR_24<0.05,"sig","not_sig")) %>%
  mutate(DNR_sig_3=factor(DNR_sig_3,levels=c("sig","not_sig")),
         DNR_sig_24=factor(DNR_sig_24,levels=c("sig","not_sig"))) %>%
  left_join(.,my_MTX_data,by=c("genes"="genes")) %>%
  mutate(MTX_sig_3=if_else(adj.P.Val_MTX_3<0.05,"sig","not_sig"),
         MTX_sig_24=if_else(adj.P.Val_MTX_24<0.05,"sig","not_sig")) %>%
  mutate(MTX_sig_3=factor(MTX_sig_3,levels=c("sig","not_sig")),
         MTX_sig_24=factor(MTX_sig_24,levels=c("sig","not_sig")))
DOX_3_TE_mat <- annotated_peaks %>%
group_by(TE_status,DOX_sig_3) %>%
tally() %>%
pivot_wider(., id_cols=TE_status,names_from = DOX_sig_3,values_from = n) %>%
column_to_rownames("TE_status") %>%
as.matrix()From the code above, #### DOX
# Vector of status-type column names in your data
status_columns <- c("TE_status", "SINE_status", "LINE_status", "LTR_status", "DNA_status", "SVA_status")

# Create a list of matrices, named by status type
DOX_3_status_matrices <- map(status_columns, function(status_col) {
  # Extract prefix (e.g., "TE", "SINE") from column name like "TE_status"
  prefix <- sub("_status$", "", status_col)
  expected_rows <- c(paste0(prefix, "_peak"), paste0("not_", prefix, "_peak"))
  expected_cols <- c("sig", "not_sig")

  # Build matrix
  mat <- annotated_peaks %>%
    group_by(across(all_of(status_col)), DOX_sig_3) %>%
    tally() %>%
    pivot_wider(
      names_from = DOX_sig_3,
      values_from = n,
      values_fill = list(n = 0)
    ) %>%
    column_to_rownames(var = status_col) %>%
    as.matrix()
   print(mat)

  # Fill missing expected rows
  for (r in setdiff(expected_rows, rownames(mat))) {
    mat <- rbind(mat, setNames(rep(0, length(expected_cols)), expected_cols))
    rownames(mat)[nrow(mat)] <- r
  }

  # Fill missing expected columns
  for (c in setdiff(expected_cols, colnames(mat))) {
    mat <- cbind(mat, setNames(rep(0, nrow(mat)), c))
  }

  # Order
  mat <- mat[expected_rows, expected_cols, drop = FALSE]
})
sig not_sig
TE_peak 2316 101833
not_TE_peak 1157 50251
sig not_sig
SINE_peak 1028 41766
not_SINE_peak 2445 110318
sig not_sig
LINE_peak 780 33372
not_LINE_peak 2693 118712
sig not_sig
LTR_peak 407 22282
not_LTR_peak 3066 129802
sig not_sig
DNA_peak 297 14796
not_DNA_peak 3176 137288
sig not_sig
SVA_peak 3 288
not_SVA_peak 3470 151796# Set names so you can easily refer to each status
names(DOX_3_status_matrices) <- status_columns
odds_ratio_results_DOX_3 <- map(DOX_3_status_matrices, function(mat) {
if (!all(dim(mat) == c(2, 2))) return(NULL)
result <- epitools::oddsratio(mat, method = "wald")
or <- result$measure[2, "estimate"]
lower <- result$measure[2, "lower"]
upper <- result$measure[2, "upper"]
pval_chisq <- if("chi.square" %in% colnames(result$p.value) && nrow(result$p.value) >= 2) {
result$p.value[2, "chi.square"]
} else {
NA_real_
}
list(
odds_ratio = or,
lower_ci = lower,
upper_ci = upper,
chi_sq_p = pval_chisq
)
})# Create a list of matrices, named by status type
DOX_24_status_matrices <- map(status_columns, function(status_col) {
# Extract prefix (e.g., "TE", "SINE") from column name like "TE_status"
prefix <- sub("_status$", "", status_col)
expected_rows <- c(paste0(prefix, "_peak"), paste0("not_", prefix, "_peak"))
expected_cols <- c("sig", "not_sig")
# Build matrix
mat <- annotated_peaks %>%
group_by(across(all_of(status_col)), DOX_sig_24) %>%
tally() %>%
pivot_wider(
names_from = DOX_sig_24,
values_from = n,
values_fill = list(n = 0)
) %>%
column_to_rownames(var = status_col) %>%
as.matrix()
print(mat)
# Fill missing expected rows
for (r in setdiff(expected_rows, rownames(mat))) {
mat <- rbind(mat, setNames(rep(0, length(expected_cols)), expected_cols))
rownames(mat)[nrow(mat)] <- r
}
# Fill missing expected columns
for (c in setdiff(expected_cols, colnames(mat))) {
mat <- cbind(mat, setNames(rep(0, nrow(mat)), c))
}
# Order
mat <- mat[expected_rows, expected_cols, drop = FALSE]
}) sig not_sig
TE_peak 44303 59846
not_TE_peak 20517 30891
sig not_sig
SINE_peak 19128 23666
not_SINE_peak 45692 67071
sig not_sig
LINE_peak 15208 18944
not_LINE_peak 49612 71793
sig not_sig
LTR_peak 9971 12718
not_LTR_peak 54849 78019
sig not_sig
DNA_peak 6778 8315
not_DNA_peak 58042 82422
sig not_sig
SVA_peak 79 212
not_SVA_peak 64741 90525# Set names so you can easily refer to each status
names(DOX_24_status_matrices) <- status_columns
odds_ratio_results_DOX_24 <- map(DOX_24_status_matrices, function(mat) {
if (!all(dim(mat) == c(2, 2))) return(NULL)
result <- epitools::oddsratio(mat, method = "wald")
or <- result$measure[2, "estimate"]
lower <- result$measure[2, "lower"]
upper <- result$measure[2, "upper"]
pval_chisq <- if("chi.square" %in% colnames(result$p.value) && nrow(result$p.value) >= 2) {
result$p.value[2, "chi.square"]
} else {
NA_real_
}
list(
odds_ratio = or,
lower_ci = lower,
upper_ci = upper,
chi_sq_p = pval_chisq
)
})EPI
# Vector of status-type column names in your data
status_columns <- c("TE_status", "SINE_status", "LINE_status", "LTR_status", "DNA_status", "SVA_status")

# Create a list of matrices, named by status type
EPI_3_status_matrices <- map(status_columns, function(status_col) {
  # Extract prefix (e.g., "TE", "SINE") from column name like "TE_status"
  prefix <- sub("_status$", "", status_col)
  expected_rows <- c(paste0(prefix, "_peak"), paste0("not_", prefix, "_peak"))
  expected_cols <- c("sig", "not_sig")

  # Build matrix
  mat <- annotated_peaks %>%
    group_by(across(all_of(status_col)), EPI_sig_3) %>%
    tally() %>%
    pivot_wider(
      names_from = EPI_sig_3,
      values_from = n,
      values_fill = list(n = 0)
    ) %>%
    column_to_rownames(var = status_col) %>%
    as.matrix()
   print(mat)

  # Fill missing expected rows
  for (r in setdiff(expected_rows, rownames(mat))) {
    mat <- rbind(mat, setNames(rep(0, length(expected_cols)), expected_cols))
    rownames(mat)[nrow(mat)] <- r
  }

  # Fill missing expected columns
  for (c in setdiff(expected_cols, colnames(mat))) {
    mat <- cbind(mat, setNames(rep(0, nrow(mat)), c))
  }

  # Order
  mat <- mat[expected_rows, expected_cols, drop = FALSE]
})
sig not_sig
TE_peak 9688 94461
not_TE_peak 4546 46862
sig not_sig
SINE_peak 4196 38598
not_SINE_peak 10038 102725
sig not_sig
LINE_peak 3031 31121
not_LINE_peak 11203 110202
sig not_sig
LTR_peak 1590 21099
not_LTR_peak 12644 120224
sig not_sig
DNA_peak 1265 13828
not_DNA_peak 12969 127495
sig not_sig
SVA_peak 32 259
not_SVA_peak 14202 141064# Set names so you can easily refer to each status
names(EPI_3_status_matrices) <- status_columns
odds_ratio_results_EPI_3 <- map(EPI_3_status_matrices, function(mat) {
if (!all(dim(mat) == c(2, 2))) return(NULL)
result <- epitools::oddsratio(mat, method = "wald")
or <- result$measure[2, "estimate"]
lower <- result$measure[2, "lower"]
upper <- result$measure[2, "upper"]
pval_chisq <- if("chi.square" %in% colnames(result$p.value) && nrow(result$p.value) >= 2) {
result$p.value[2, "chi.square"]
} else {
NA_real_
}
list(
odds_ratio = or,
lower_ci = lower,
upper_ci = upper,
chi_sq_p = pval_chisq
)
})# Create a list of matrices, named by status type
EPI_24_status_matrices <- map(status_columns, function(status_col) {
# Extract prefix (e.g., "TE", "SINE") from column name like "TE_status"
prefix <- sub("_status$", "", status_col)
expected_rows <- c(paste0(prefix, "_peak"), paste0("not_", prefix, "_peak"))
expected_cols <- c("sig", "not_sig")
# Build matrix
mat <- annotated_peaks %>%
group_by(across(all_of(status_col)), EPI_sig_24) %>%
tally() %>%
pivot_wider(
names_from = EPI_sig_24,
values_from = n,
values_fill = list(n = 0)
) %>%
column_to_rownames(var = status_col) %>%
as.matrix()
print(mat)
# Fill missing expected rows
for (r in setdiff(expected_rows, rownames(mat))) {
mat <- rbind(mat, setNames(rep(0, length(expected_cols)), expected_cols))
rownames(mat)[nrow(mat)] <- r
}
# Fill missing expected columns
for (c in setdiff(expected_cols, colnames(mat))) {
mat <- cbind(mat, setNames(rep(0, nrow(mat)), c))
}
# Order
mat <- mat[expected_rows, expected_cols, drop = FALSE]
}) sig not_sig
TE_peak 45302 58847
not_TE_peak 21199 30209
sig not_sig
SINE_peak 19441 23353
not_SINE_peak 47060 65703
sig not_sig
LINE_peak 15530 18622
not_LINE_peak 50971 70434
sig not_sig
LTR_peak 10179 12510
not_LTR_peak 56322 76546
sig not_sig
DNA_peak 6903 8190
not_DNA_peak 59598 80866
sig not_sig
SVA_peak 105 186
not_SVA_peak 66396 88870# Set names so you can easily refer to each status
names(EPI_24_status_matrices) <- status_columns
odds_ratio_results_EPI_24 <- map(EPI_24_status_matrices, function(mat) {
if (!all(dim(mat) == c(2, 2))) return(NULL)
result <- epitools::oddsratio(mat, method = "wald")
or <- result$measure[2, "estimate"]
lower <- result$measure[2, "lower"]
upper <- result$measure[2, "upper"]
pval_chisq <- if("chi.square" %in% colnames(result$p.value) && nrow(result$p.value) >= 2) {
result$p.value[2, "chi.square"]
} else {
NA_real_
}
list(
odds_ratio = or,
lower_ci = lower,
upper_ci = upper,
chi_sq_p = pval_chisq
)
})DNR
# Vector of status-type column names in your data
status_columns <- c("TE_status", "SINE_status", "LINE_status", "LTR_status", "DNA_status", "SVA_status")

# Create a list of matrices, named by status type
DNR_3_status_matrices <- map(status_columns, function(status_col) {
  # Extract prefix (e.g., "TE", "SINE") from column name like "TE_status"
  prefix <- sub("_status$", "", status_col)
  expected_rows <- c(paste0(prefix, "_peak"), paste0("not_", prefix, "_peak"))
  expected_cols <- c("sig", "not_sig")

  # Build matrix
  mat <- annotated_peaks %>%
    group_by(across(all_of(status_col)), DNR_sig_3) %>%
    tally() %>%
    pivot_wider(
      names_from = DNR_sig_3,
      values_from = n,
      values_fill = list(n = 0)
    ) %>%
    column_to_rownames(var = status_col) %>%
    as.matrix()
   print(mat)

  # Fill missing expected rows
  for (r in setdiff(expected_rows, rownames(mat))) {
    mat <- rbind(mat, setNames(rep(0, length(expected_cols)), expected_cols))
    rownames(mat)[nrow(mat)] <- r
  }

  # Fill missing expected columns
  for (c in setdiff(expected_cols, colnames(mat))) {
    mat <- cbind(mat, setNames(rep(0, nrow(mat)), c))
  }

  # Order
  mat <- mat[expected_rows, expected_cols, drop = FALSE]
})
sig not_sig
TE_peak 15675 88474
not_TE_peak 7063 44345
sig not_sig
SINE_peak 6517 36277
not_SINE_peak 16221 96542
sig not_sig
LINE_peak 4652 29500
not_LINE_peak 18086 103319
sig not_sig
LTR_peak 2529 20160
not_LTR_peak 20209 112659
sig not_sig
DNA_peak 1923 13170
not_DNA_peak 20815 119649
sig not_sig
SVA_peak 56 235
not_SVA_peak 22682 132584# Set names so you can easily refer to each status
names(DNR_3_status_matrices) <- status_columns
odds_ratio_results_DNR_3 <- map(DNR_3_status_matrices, function(mat) {
if (!all(dim(mat) == c(2, 2))) return(NULL)
result <- epitools::oddsratio(mat, method = "wald")
or <- result$measure[2, "estimate"]
lower <- result$measure[2, "lower"]
upper <- result$measure[2, "upper"]
pval_chisq <- if("chi.square" %in% colnames(result$p.value) && nrow(result$p.value) >= 2) {
result$p.value[2, "chi.square"]
} else {
NA_real_
}
list(
odds_ratio = or,
lower_ci = lower,
upper_ci = upper,
chi_sq_p = pval_chisq
)
})# Create a list of matrices, named by status type
DNR_24_status_matrices <- map(status_columns, function(status_col) {
# Extract prefix (e.g., "TE", "SINE") from column name like "TE_status"
prefix <- sub("_status$", "", status_col)
expected_rows <- c(paste0(prefix, "_peak"), paste0("not_", prefix, "_peak"))
expected_cols <- c("sig", "not_sig")
# Build matrix
mat <- annotated_peaks %>%
group_by(across(all_of(status_col)), DNR_sig_24) %>%
tally() %>%
pivot_wider(
names_from = DNR_sig_24,
values_from = n,
values_fill = list(n = 0)
) %>%
column_to_rownames(var = status_col) %>%
as.matrix()
print(mat)
# Fill missing expected rows
for (r in setdiff(expected_rows, rownames(mat))) {
mat <- rbind(mat, setNames(rep(0, length(expected_cols)), expected_cols))
rownames(mat)[nrow(mat)] <- r
}
# Fill missing expected columns
for (c in setdiff(expected_cols, colnames(mat))) {
mat <- cbind(mat, setNames(rep(0, nrow(mat)), c))
}
# Order
mat <- mat[expected_rows, expected_cols, drop = FALSE]
}) sig not_sig
TE_peak 54566 49583
not_TE_peak 25429 25979
sig not_sig
SINE_peak 22919 19875
not_SINE_peak 57076 55687
sig not_sig
LINE_peak 18231 15921
not_LINE_peak 61764 59641
sig not_sig
LTR_peak 12018 10671
not_LTR_peak 67977 64891
sig not_sig
DNA_peak 8057 7036
not_DNA_peak 71938 68526
sig not_sig
SVA_peak 122 169
not_SVA_peak 79873 75393# Set names so you can easily refer to each status
names(DNR_24_status_matrices) <- status_columns
odds_ratio_results_DNR_24 <- map(DNR_24_status_matrices, function(mat) {
if (!all(dim(mat) == c(2, 2))) return(NULL)
result <- epitools::oddsratio(mat, method = "wald")
or <- result$measure[2, "estimate"]
lower <- result$measure[2, "lower"]
upper <- result$measure[2, "upper"]
pval_chisq <- if("chi.square" %in% colnames(result$p.value) && nrow(result$p.value) >= 2) {
result$p.value[2, "chi.square"]
} else {
NA_real_
}
list(
odds_ratio = or,
lower_ci = lower,
upper_ci = upper,
chi_sq_p = pval_chisq
)
})MTX
# Vector of status-type column names in your data
status_columns <- c("TE_status", "SINE_status", "LINE_status", "LTR_status", "DNA_status", "SVA_status")

# Create a list of matrices, named by status type
MTX_3_status_matrices <- map(status_columns, function(status_col) {
  # Extract prefix (e.g., "TE", "SINE") from column name like "TE_status"
  prefix <- sub("_status$", "", status_col)
  expected_rows <- c(paste0(prefix, "_peak"), paste0("not_", prefix, "_peak"))
  expected_cols <- c("sig", "not_sig")

  # Build matrix
  mat <- annotated_peaks %>%
    group_by(across(all_of(status_col)), MTX_sig_3) %>%
    tally() %>%
    pivot_wider(
      names_from = MTX_sig_3,
      values_from = n,
      values_fill = list(n = 0)
    ) %>%
    column_to_rownames(var = status_col) %>%
    as.matrix()
   print(mat)

  # Fill missing expected rows
  for (r in setdiff(expected_rows, rownames(mat))) {
    mat <- rbind(mat, setNames(rep(0, length(expected_cols)), expected_cols))
    rownames(mat)[nrow(mat)] <- r
  }

  # Fill missing expected columns
  for (c in setdiff(expected_cols, colnames(mat))) {
    mat <- cbind(mat, setNames(rep(0, nrow(mat)), c))
  }

  # Order
  mat <- mat[expected_rows, expected_cols, drop = FALSE]
})
sig not_sig
TE_peak 568 103581
not_TE_peak 236 51172
sig not_sig
SINE_peak 220 42574
not_SINE_peak 584 112179
sig not_sig
LINE_peak 174 33978
not_LINE_peak 630 120775
sig not_sig
LTR_peak 114 22575
not_LTR_peak 690 132178
sig not_sig
DNA_peak 86 15007
not_DNA_peak 718 139746
sig not_sig
SVA_peak 1 290
not_SVA_peak 803 154463# Set names so you can easily refer to each status
names(MTX_3_status_matrices) <- status_columns
odds_ratio_results_MTX_3 <- map(MTX_3_status_matrices, function(mat) {
if (!all(dim(mat) == c(2, 2))) return(NULL)
result <- epitools::oddsratio(mat, method = "wald")
or <- result$measure[2, "estimate"]
lower <- result$measure[2, "lower"]
upper <- result$measure[2, "upper"]
pval_chisq <- if("chi.square" %in% colnames(result$p.value) && nrow(result$p.value) >= 2) {
result$p.value[2, "chi.square"]
} else {
NA_real_
}
list(
odds_ratio = or,
lower_ci = lower,
upper_ci = upper,
chi_sq_p = pval_chisq
)
})# Create a list of matrices, named by status type
MTX_24_status_matrices <- map(status_columns, function(status_col) {
# Extract prefix (e.g., "TE", "SINE") from column name like "TE_status"
prefix <- sub("_status$", "", status_col)
expected_rows <- c(paste0(prefix, "_peak"), paste0("not_", prefix, "_peak"))
expected_cols <- c("sig", "not_sig")
# Build matrix
mat <- annotated_peaks %>%
group_by(across(all_of(status_col)), MTX_sig_24) %>%
tally() %>%
pivot_wider(
names_from = MTX_sig_24,
values_from = n,
values_fill = list(n = 0)
) %>%
column_to_rownames(var = status_col) %>%
as.matrix()
print(mat)
# Fill missing expected rows
for (r in setdiff(expected_rows, rownames(mat))) {
mat <- rbind(mat, setNames(rep(0, length(expected_cols)), expected_cols))
rownames(mat)[nrow(mat)] <- r
}
# Fill missing expected columns
for (c in setdiff(expected_cols, colnames(mat))) {
mat <- cbind(mat, setNames(rep(0, nrow(mat)), c))
}
# Order
mat <- mat[expected_rows, expected_cols, drop = FALSE]
}) sig not_sig
TE_peak 16922 87227
not_TE_peak 7328 44080
sig not_sig
SINE_peak 7114 35680
not_SINE_peak 17136 95627
sig not_sig
LINE_peak 5596 28556
not_LINE_peak 18654 102751
sig not_sig
LTR_peak 3564 19125
not_LTR_peak 20686 112182
sig not_sig
DNA_peak 2445 12648
not_DNA_peak 21805 118659
sig not_sig
SVA_peak 17 274
not_SVA_peak 24233 131033# Set names so you can easily refer to each status
names(MTX_24_status_matrices) <- status_columns
odds_ratio_results_MTX_24 <- map(MTX_24_status_matrices, function(mat) {
if (!all(dim(mat) == c(2, 2))) return(NULL)
result <- epitools::oddsratio(mat, method = "wald")
or <- result$measure[2, "estimate"]
lower <- result$measure[2, "lower"]
upper <- result$measure[2, "upper"]
pval_chisq <- if("chi.square" %in% colnames(result$p.value) && nrow(result$p.value) >= 2) {
result$p.value[2, "chi.square"]
} else {
NA_real_
}
list(
odds_ratio = or,
lower_ci = lower,
upper_ci = upper,
chi_sq_p = pval_chisq
)
})Combining the data and applying BH pvalue adjustments
# odds_ratio_results_DOX_3
# odds_ratio_results_DOX_24
# odds_ratio_results_DOX_24_sig_up
# odds_ratio_results_DOX_24_sig_down

combined_df <- bind_rows(
  map_dfr(odds_ratio_results_DOX_3, ~as.data.frame(.x), .id = "status") %>% mutate(source = "DOX_3hr"),
  map_dfr(odds_ratio_results_DOX_24, ~as.data.frame(.x), .id = "status") %>% mutate(source = "DOX_24hr"),
  map_dfr(odds_ratio_results_EPI_3, ~as.data.frame(.x), .id = "status") %>% mutate(source = "EPI_3hr"),
  map_dfr(odds_ratio_results_EPI_24, ~as.data.frame(.x), .id = "status") %>% mutate(source = "EPI_24hr"),
  map_dfr(odds_ratio_results_DNR_3, ~as.data.frame(.x), .id = "status") %>% mutate(source = "DNR_3hr"),
  map_dfr(odds_ratio_results_DNR_24, ~as.data.frame(.x), .id = "status") %>% mutate(source = "DNR_24hr"),
  map_dfr(odds_ratio_results_MTX_3, ~as.data.frame(.x), .id = "status") %>% mutate(source = "MTX_3hr"),
  map_dfr(odds_ratio_results_MTX_24, ~as.data.frame(.x), .id = "status") %>% mutate(source = "MTX_24hr")
)
# saveRDS(combined_df,"data/Final_four_data/re_analysis/OR_results_TE_df_1bp_alltrt.RDS")
TE_sig_mat <- combined_df %>%
dplyr::select( status,source,chi_sq_p) %>%
group_by(source) %>%
mutate(rank_val=rank(chi_sq_p, ties.method = "first")) %>%
mutate(BH_correction= p.adjust(chi_sq_p,method= "BH")) %>%
pivot_wider(., id_cols = status, names_from = source, values_from = BH_correction) %>%
column_to_rownames("status") %>%
as.matrix()
col_fun_OR = colorRamp2(c(0,1,1.5,5), c("blueviolet","white","lightgreen","green3" ))
# TE_od_mat <-
combined_df %>%
dplyr::select(status, source, odds_ratio) %>%
group_by(source) %>%
pivot_wider(., id_cols = status, names_from = source, values_from = odds_ratio) %>%
column_to_rownames("status") %>%
as.matrix() %>%
ComplexHeatmap::Heatmap(. ,col = col_fun_OR,
cluster_rows=FALSE,
cluster_columns=FALSE,
column_names_side = "top",
column_names_rot = 45,
# na_col = "black",
cell_fun = function(j, i, x, y, width, height, fill) {if (!is.na(TE_sig_mat[i, j]) && TE_sig_mat[i, j] < 0.05 && .[i, j] > 1) {
grid.text("*", x, y, gp = gpar(fontsize = 20))}})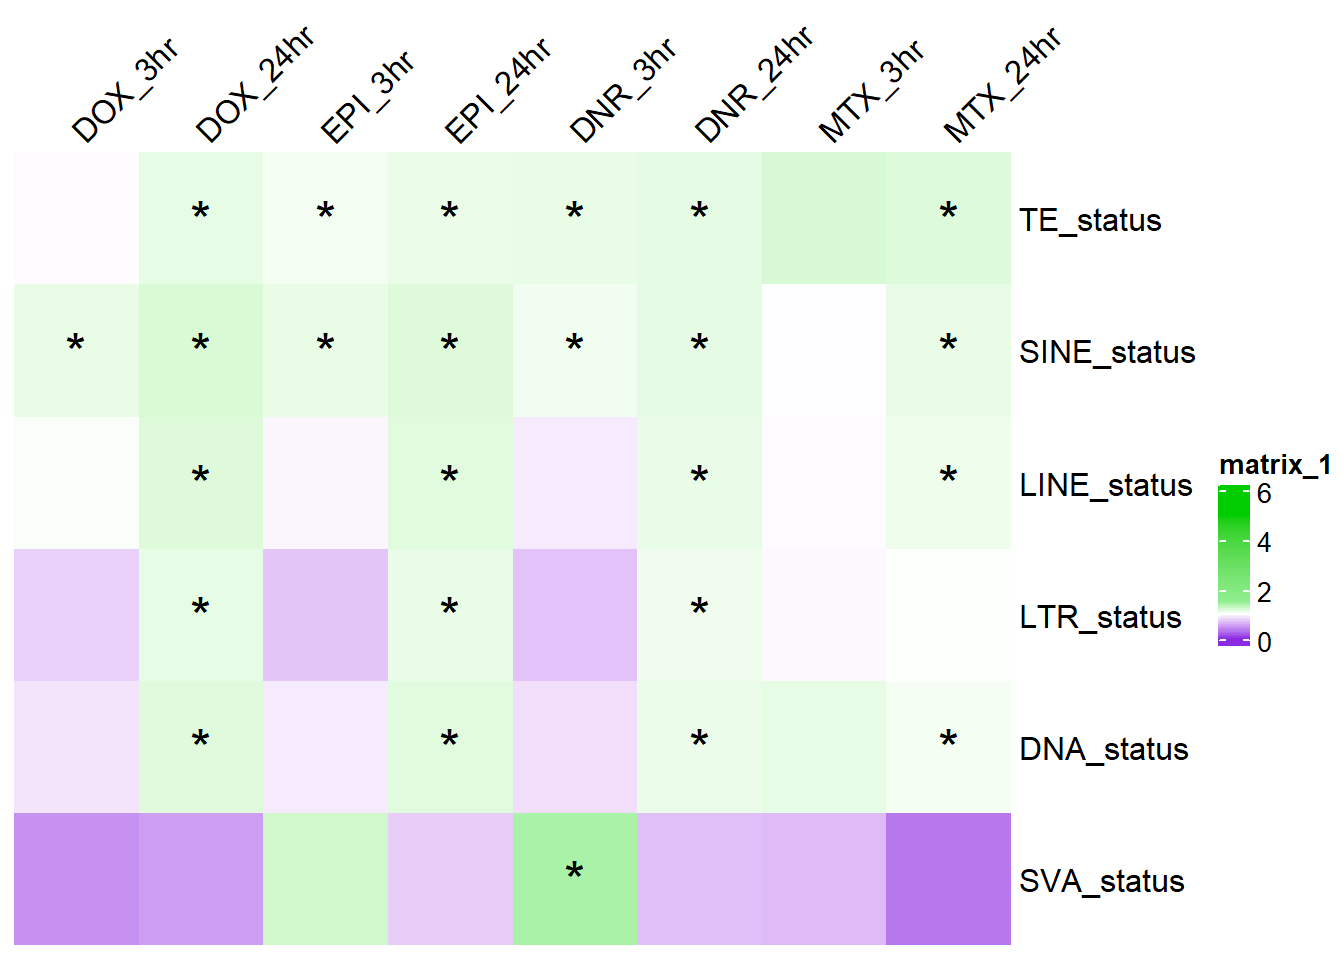
| Version | Author | Date |
|---|---|---|
| af91ecf | reneeisnowhere | 2025-06-18 |
Looking at LTR class breakdown
TE_catagories <- overlap_TE_gr %>% as.data.frame() %>%
  dplyr::select(Peakid,repName:id) %>%
  distinct() %>%
  mutate(repClass_org = repClass) %>% #copy repClass for storage
  mutate(repClass=if_else(##relable repClass with other
    repClass_org=="LINE", repClass_org,if_else(repClass_org=="SINE",repClass_org,if_else(repClass_org=="LTR", repClass_org, if_else(repClass_org=="DNA", repClass_org, if_else(repClass_org=="Retroposon",repClass_org,"Other"))))))


LTR_df <- LTR_repeats %>%
  as.data.frame() %>%
  mutate(repName=factor(repName))

scale_fill_LTRs <-  function(...){
  ggplot2:::manual_scale(
    'fill',
    values = setNames(c( "#8DD3C7",
                         "#FFFFB3",
                         "#BEBADA" ,
                         "#FB8072",
                         "#80B1D3",
                         "#FDB462",
                         "#B3DE69",
                         "#FCCDE5",
                         "#D9D9D9",
                         "#BC80BD",
                         "#CCEBC5",
                         "pink4",
                         "cornflowerblue",
                         "chocolate",
                         "brown",
                         "green",
                         "yellow4",
                         "purple",
                         "darkorchid4",
                         "coral4",
                         "darkolivegreen4",
                         "darkorange"), unique(LTR_df$repFamily)),
    ...
  )
}

# TE_catagories
h.genome_df <- repeatmasker %>%
mutate(repClass_org = repClass) %>% #copy repClass for storage
mutate(repClass=if_else(##relable repClass with other
repClass_org=="LINE", repClass_org,if_else(repClass_org=="SINE",repClass_org,if_else(repClass_org=="LTR", repClass_org, if_else(repClass_org=="DNA", repClass_org, if_else(repClass_org=="Retroposon",repClass_org,"Other")))))) %>%
mutate(Peakid=paste0(rownames(.),"_TE")) %>%
dplyr::select(Peakid,repName,repClass, repFamily,repClass_org) %>%
mutate(TE_status ="TE_peak", trt="h.genome")
ggLTR_df <-annotated_peaks %>%
dplyr::left_join(TE_catagories,by=c("genes" = "Peakid")) %>%
dplyr::filter(LTR_status=="LTR_peak") %>%
dplyr::filter(repClass_org=="LTR") %>%
dplyr::rename("Peakid"=genes) %>%
dplyr::select(Peakid, repName, repClass,repFamily,repClass_org,TE_status) %>%
distinct(Peakid, TE_status,repClass,.keep_all = TRUE) %>%
mutate(trt="all_peaks")DNR_3_df <- annotated_peaks %>%
left_join(TE_catagories,by=c("genes" = "Peakid")) %>%
dplyr::filter(repClass_org=="LTR") %>%
dplyr::filter(DNR_sig_3=="sig") %>%
dplyr::rename("Peakid"=genes) %>%
dplyr::select(Peakid, repName, repClass,repFamily,repClass_org,TE_status) %>%
distinct(Peakid, TE_status,repClass,.keep_all = TRUE) %>%
mutate(trt="DNR_3")
DNR_24_df <- annotated_peaks %>%
left_join(TE_catagories,by=c("genes" = "Peakid")) %>%
dplyr::filter(repClass_org=="LTR") %>%
dplyr::filter(DNR_sig_24=="sig") %>%
dplyr::rename("Peakid"=genes) %>%
dplyr::select(Peakid, repName, repClass,repFamily,repClass_org,TE_status) %>%
distinct(Peakid, TE_status,repClass,.keep_all = TRUE) %>%
mutate(trt="DNR_24")
DOX_3_df <- annotated_peaks %>%
left_join(TE_catagories,by=c("genes" = "Peakid")) %>%
dplyr::filter(repClass_org=="LTR") %>%
dplyr::filter(DOX_sig_3=="sig") %>%
dplyr::rename("Peakid"=genes) %>%
dplyr::select(Peakid, repName, repClass,repFamily,repClass_org,TE_status) %>%
distinct(Peakid, TE_status,repClass,.keep_all = TRUE) %>%
mutate(trt="DOX_3")
DOX_24_df <- annotated_peaks %>%
left_join(TE_catagories,by=c("genes" = "Peakid")) %>%
dplyr::filter(repClass_org=="LTR") %>%
dplyr::filter(DOX_sig_24=="sig") %>%
dplyr::rename("Peakid"=genes) %>%
dplyr::select(Peakid, repName, repClass,repFamily,repClass_org,TE_status) %>%
distinct(Peakid, TE_status,repClass,.keep_all = TRUE) %>%
mutate(trt="DOX_24")
EPI_3_df <- annotated_peaks %>%
left_join(TE_catagories,by=c("genes" = "Peakid")) %>%
dplyr::filter(repClass_org=="LTR") %>%
dplyr::filter(EPI_sig_3=="sig") %>%
dplyr::rename("Peakid"=genes) %>%
dplyr::select(Peakid, repName, repClass,repFamily,repClass_org,TE_status) %>%
distinct(Peakid, TE_status,repClass,.keep_all = TRUE) %>%
mutate(trt="EPI_3")
EPI_24_df <- annotated_peaks %>%
left_join(TE_catagories,by=c("genes" = "Peakid")) %>%
dplyr::filter(repClass_org=="LTR") %>%
dplyr::filter(DNR_sig_24=="sig") %>%
dplyr::rename("Peakid"=genes) %>%
dplyr::select(Peakid, repName, repClass,repFamily,repClass_org,TE_status) %>%
distinct(Peakid, TE_status,repClass,.keep_all = TRUE) %>%
mutate(trt="EPI_24")
MTX_3_df <- annotated_peaks %>%
left_join(TE_catagories,by=c("genes" = "Peakid")) %>%
dplyr::filter(repClass_org=="LTR") %>%
dplyr::filter(MTX_sig_3=="sig") %>%
dplyr::rename("Peakid"=genes) %>%
dplyr::select(Peakid, repName, repClass,repFamily,repClass_org,TE_status) %>%
distinct(Peakid, TE_status,repClass,.keep_all = TRUE) %>%
mutate(trt="MTX_3")
MTX_24_df <- annotated_peaks %>%
left_join(TE_catagories,by=c("genes" = "Peakid")) %>%
dplyr::filter(repClass_org=="LTR") %>%
dplyr::filter(MTX_sig_24=="sig") %>%
dplyr::rename("Peakid"=genes) %>%
dplyr::select(Peakid, repName, repClass,repFamily,repClass_org,TE_status) %>%
distinct(Peakid, TE_status,repClass,.keep_all = TRUE) %>%
mutate(trt="MTX_24")h.genome_LTR_combo<-h.genome_df %>%
dplyr::filter(repClass_org=="LTR") %>%
rbind(ggLTR_df) %>%
rbind(DOX_3_df) %>%
rbind(DOX_24_df) %>%
rbind(EPI_3_df) %>%
rbind(EPI_24_df) %>%
rbind(DNR_3_df) %>%
rbind(DNR_24_df) %>%
rbind(MTX_3_df) %>%
rbind(MTX_24_df)
h.genome_LTR_combo %>%
dplyr::filter(TE_status=="TE_peak") %>%
mutate(trt=factor(trt, levels=c("h.genome","all_peaks","DOX_3","EPI_3","DNR_3","MTX_3","DOX_24","EPI_24","DNR_24","MTX_24"))) %>%
ggplot(., aes(x=trt, fill= repFamily))+
geom_bar(position="fill", col="black")+
theme_bw()+
ggtitle("LTR breakdown across response classes")+
scale_fill_LTRs()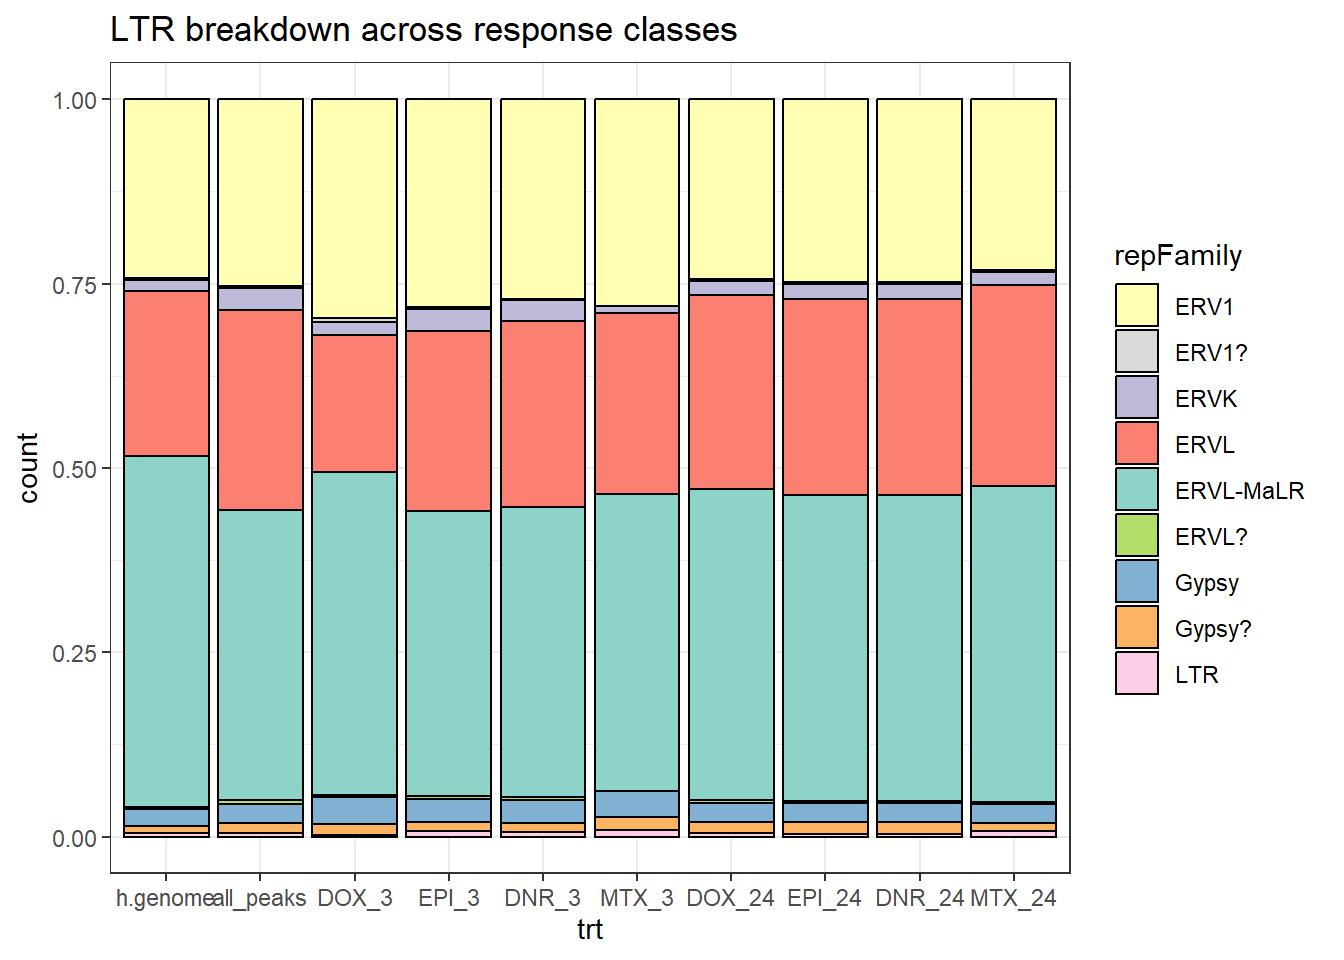
| Version | Author | Date |
|---|---|---|
| e7c389e | reneeisnowhere | 2025-07-23 |
ggLINE_df <-annotated_peaks %>%
  dplyr::left_join(TE_catagories,by=c("genes" = "Peakid")) %>%
  # dplyr::filter(LTR_status=="LINE_peak") %>%
  dplyr::filter(repClass_org=="LINE") %>%
  dplyr::rename("Peakid"=genes) %>%
  dplyr::select(Peakid, repName, repClass,repFamily,repClass_org,TE_status) %>%
  distinct(Peakid, TE_status,repClass,.keep_all = TRUE) %>%
  mutate(trt="all_peaks")


DNR_3_df_LINE <- annotated_peaks %>%
  left_join(TE_catagories,by=c("genes" = "Peakid")) %>%
  dplyr::filter(repClass_org=="LINE") %>%
  dplyr::filter(DNR_sig_3=="sig") %>%
  dplyr::rename("Peakid"=genes) %>%
   dplyr::select(Peakid, repName, repClass,repFamily,repClass_org,TE_status) %>%
  distinct(Peakid, TE_status,repClass,.keep_all = TRUE) %>%
  mutate(trt="DNR_3")

DNR_24_df_LINE <- annotated_peaks %>%
  left_join(TE_catagories,by=c("genes" = "Peakid")) %>%
 dplyr::filter(repClass_org=="LINE") %>%
  dplyr::filter(DNR_sig_24=="sig") %>%
  dplyr::rename("Peakid"=genes) %>%
   dplyr::select(Peakid, repName, repClass,repFamily,repClass_org,TE_status) %>%
  distinct(Peakid, TE_status,repClass,.keep_all = TRUE) %>%
  mutate(trt="DNR_24")

DOX_3_df_LINE <- annotated_peaks %>%
  left_join(TE_catagories,by=c("genes" = "Peakid")) %>%
  dplyr::filter(repClass_org=="LINE") %>%
  dplyr::filter(DOX_sig_3=="sig") %>%
  dplyr::rename("Peakid"=genes) %>%
   dplyr::select(Peakid, repName, repClass,repFamily,repClass_org,TE_status) %>%
  distinct(Peakid, TE_status,repClass,.keep_all = TRUE) %>%
  mutate(trt="DOX_3")

DOX_24_df_LINE <- annotated_peaks %>%
  left_join(TE_catagories,by=c("genes" = "Peakid")) %>%
  dplyr::filter(repClass_org=="LINE") %>%
  dplyr::filter(DOX_sig_24=="sig") %>%
  dplyr::rename("Peakid"=genes) %>%
   dplyr::select(Peakid, repName, repClass,repFamily,repClass_org,TE_status) %>%
  distinct(Peakid, TE_status,repClass,.keep_all = TRUE) %>%
  mutate(trt="DOX_24")

EPI_3_df_LINE <- annotated_peaks %>%
  left_join(TE_catagories,by=c("genes" = "Peakid")) %>%
  dplyr::filter(repClass_org=="LINE") %>%
  dplyr::filter(EPI_sig_3=="sig") %>%
  dplyr::rename("Peakid"=genes) %>%
   dplyr::select(Peakid, repName, repClass,repFamily,repClass_org,TE_status) %>%
  distinct(Peakid, TE_status,repClass,.keep_all = TRUE) %>%
  mutate(trt="EPI_3")

EPI_24_df_LINE <- annotated_peaks %>%
  left_join(TE_catagories,by=c("genes" = "Peakid")) %>%
  dplyr::filter(repClass_org=="LINE") %>%
  dplyr::filter(DNR_sig_24=="sig") %>%
  dplyr::rename("Peakid"=genes) %>%
   dplyr::select(Peakid, repName, repClass,repFamily,repClass_org,TE_status) %>%
  distinct(Peakid, TE_status,repClass,.keep_all = TRUE) %>%
  mutate(trt="EPI_24")

MTX_3_df_LINE <- annotated_peaks %>%
  left_join(TE_catagories,by=c("genes" = "Peakid")) %>%
  dplyr::filter(repClass_org=="LINE") %>%
  dplyr::filter(MTX_sig_3=="sig") %>%
  dplyr::rename("Peakid"=genes) %>%
   dplyr::select(Peakid, repName, repClass,repFamily,repClass_org,TE_status) %>%
  distinct(Peakid, TE_status,repClass,.keep_all = TRUE) %>%
  mutate(trt="MTX_3")

MTX_24_df_LINE <- annotated_peaks %>%
  left_join(TE_catagories,by=c("genes" = "Peakid")) %>%
  dplyr::filter(repClass_org=="LINE") %>%
  dplyr::filter(MTX_sig_24=="sig") %>%
  dplyr::rename("Peakid"=genes) %>%
   dplyr::select(Peakid, repName, repClass,repFamily,repClass_org,TE_status) %>%
  distinct(Peakid, TE_status,repClass,.keep_all = TRUE) %>%
  mutate(trt="MTX_24")
h.genome_LINE_combo<-h.genome_df %>%
dplyr::filter(repClass_org=="LINE") %>%
rbind(ggLINE_df) %>%
rbind(DOX_3_df_LINE) %>%
rbind(DOX_24_df_LINE) %>%
rbind(EPI_3_df_LINE) %>%
rbind(EPI_24_df_LINE) %>%
rbind(DNR_3_df_LINE) %>%
rbind(DNR_24_df_LINE) %>%
rbind(MTX_3_df_LINE) %>%
rbind(MTX_24_df_LINE)
h.genome_LINE_combo %>%
dplyr::filter(TE_status=="TE_peak") %>%
mutate(trt=factor(trt, levels=c("h.genome","all_peaks","DOX_3","EPI_3","DNR_3","MTX_3","DOX_24","EPI_24","DNR_24","MTX_24"))) %>%
ggplot(., aes(x=trt, fill= repFamily))+
geom_bar(position="fill", col="black")+
theme_bw()+
ggtitle("LINE breakdown across response classes")#+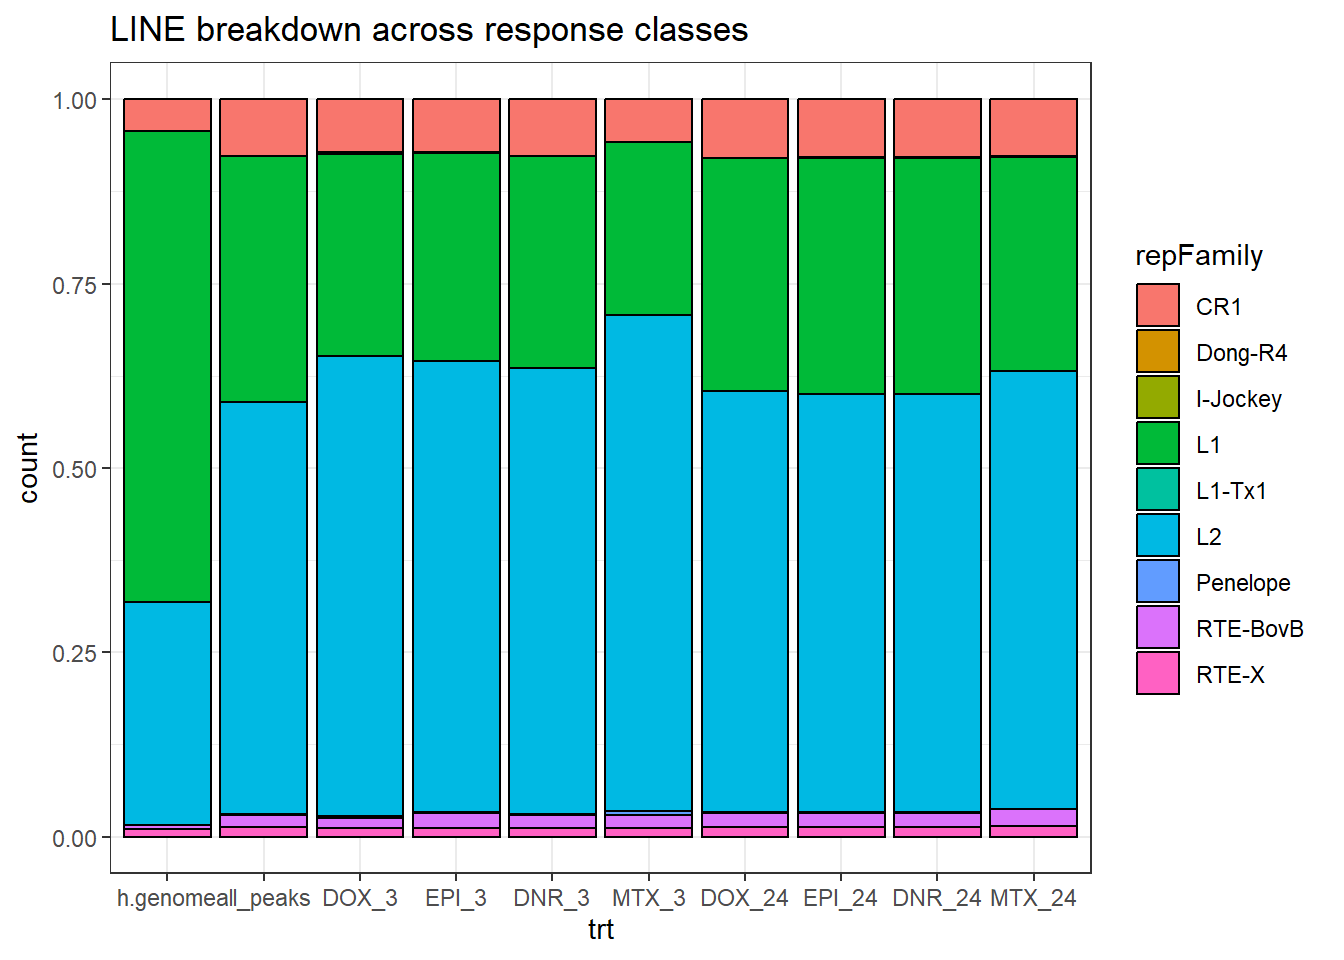
| Version | Author | Date |
|---|---|---|
| e7c389e | reneeisnowhere | 2025-07-23 |
# scale_fill_LINEs()ggSINE_df <-annotated_peaks %>%
dplyr::left_join(TE_catagories,by=c("genes" = "Peakid")) %>%
# dplyr::filter(LTR_status=="SINE_peak") %>%
dplyr::filter(repClass_org=="SINE") %>%
dplyr::rename("Peakid"=genes) %>%
dplyr::select(Peakid, repName, repClass,repFamily,repClass_org,TE_status) %>%
distinct(Peakid, TE_status,repClass,.keep_all = TRUE) %>%
mutate(trt="all_peaks")
DNR_3_df_SINE <- annotated_peaks %>%
left_join(TE_catagories,by=c("genes" = "Peakid")) %>%
dplyr::filter(repClass_org=="SINE") %>%
dplyr::filter(DNR_sig_3=="sig") %>%
dplyr::rename("Peakid"=genes) %>%
dplyr::select(Peakid, repName, repClass,repFamily,repClass_org,TE_status) %>%
distinct(Peakid, TE_status,repClass,.keep_all = TRUE) %>%
mutate(trt="DNR_3")
DNR_24_df_SINE <- annotated_peaks %>%
left_join(TE_catagories,by=c("genes" = "Peakid")) %>%
dplyr::filter(repClass_org=="SINE") %>%
dplyr::filter(DNR_sig_24=="sig") %>%
dplyr::rename("Peakid"=genes) %>%
dplyr::select(Peakid, repName, repClass,repFamily,repClass_org,TE_status) %>%
distinct(Peakid, TE_status,repClass,.keep_all = TRUE) %>%
mutate(trt="DNR_24")
DOX_3_df_SINE <- annotated_peaks %>%
left_join(TE_catagories,by=c("genes" = "Peakid")) %>%
dplyr::filter(repClass_org=="SINE") %>%
dplyr::filter(DOX_sig_3=="sig") %>%
dplyr::rename("Peakid"=genes) %>%
dplyr::select(Peakid, repName, repClass,repFamily,repClass_org,TE_status) %>%
distinct(Peakid, TE_status,repClass,.keep_all = TRUE) %>%
mutate(trt="DOX_3")
DOX_24_df_SINE <- annotated_peaks %>%
left_join(TE_catagories,by=c("genes" = "Peakid")) %>%
dplyr::filter(repClass_org=="SINE") %>%
dplyr::filter(DOX_sig_24=="sig") %>%
dplyr::rename("Peakid"=genes) %>%
dplyr::select(Peakid, repName, repClass,repFamily,repClass_org,TE_status) %>%
distinct(Peakid, TE_status,repClass,.keep_all = TRUE) %>%
mutate(trt="DOX_24")
EPI_3_df_SINE <- annotated_peaks %>%
left_join(TE_catagories,by=c("genes" = "Peakid")) %>%
dplyr::filter(repClass_org=="SINE") %>%
dplyr::filter(EPI_sig_3=="sig") %>%
dplyr::rename("Peakid"=genes) %>%
dplyr::select(Peakid, repName, repClass,repFamily,repClass_org,TE_status) %>%
distinct(Peakid, TE_status,repClass,.keep_all = TRUE) %>%
mutate(trt="EPI_3")
EPI_24_df_SINE <- annotated_peaks %>%
left_join(TE_catagories,by=c("genes" = "Peakid")) %>%
dplyr::filter(repClass_org=="SINE") %>%
dplyr::filter(DNR_sig_24=="sig") %>%
dplyr::rename("Peakid"=genes) %>%
dplyr::select(Peakid, repName, repClass,repFamily,repClass_org,TE_status) %>%
distinct(Peakid, TE_status,repClass,.keep_all = TRUE) %>%
mutate(trt="EPI_24")
MTX_3_df_SINE <- annotated_peaks %>%
left_join(TE_catagories,by=c("genes" = "Peakid")) %>%
dplyr::filter(repClass_org=="SINE") %>%
dplyr::filter(MTX_sig_3=="sig") %>%
dplyr::rename("Peakid"=genes) %>%
dplyr::select(Peakid, repName, repClass,repFamily,repClass_org,TE_status) %>%
distinct(Peakid, TE_status,repClass,.keep_all = TRUE) %>%
mutate(trt="MTX_3")
MTX_24_df_SINE <- annotated_peaks %>%
left_join(TE_catagories,by=c("genes" = "Peakid")) %>%
dplyr::filter(repClass_org=="SINE") %>%
dplyr::filter(MTX_sig_24=="sig") %>%
dplyr::rename("Peakid"=genes) %>%
dplyr::select(Peakid, repName, repClass,repFamily,repClass_org,TE_status) %>%
distinct(Peakid, TE_status,repClass,.keep_all = TRUE) %>%
mutate(trt="MTX_24")
MTX_24_df_SINE %>%
group_by(repFamily) %>%
tally()# A tibble: 6 × 2
repFamily n
<chr> <int>
1 5S-Deu-L2 36
2 Alu 3153
3 MIR 3839
4 tRNA 26
5 tRNA-Deu 4
6 tRNA-RTE 56h.genome_SINE_combo<-h.genome_df %>%
dplyr::filter(repClass_org=="SINE") %>%
rbind(ggSINE_df) %>%
rbind(DOX_3_df_SINE) %>%
rbind(DOX_24_df_SINE) %>%
rbind(EPI_3_df_SINE) %>%
rbind(EPI_24_df_SINE) %>%
rbind(DNR_3_df_SINE) %>%
rbind(DNR_24_df_SINE) %>%
rbind(MTX_3_df_SINE) %>%
rbind(MTX_24_df_SINE)
h.genome_SINE_combo %>%
dplyr::filter(TE_status=="TE_peak") %>%
mutate(trt=factor(trt, levels=c("h.genome","all_peaks","DOX_3","EPI_3","DNR_3","MTX_3","DOX_24","EPI_24","DNR_24","MTX_24"))) %>%
ggplot(., aes(x=trt, fill= repFamily))+
geom_bar(position="fill", col="black")+
theme_bw()+
ggtitle("SINE breakdown across response classes")#+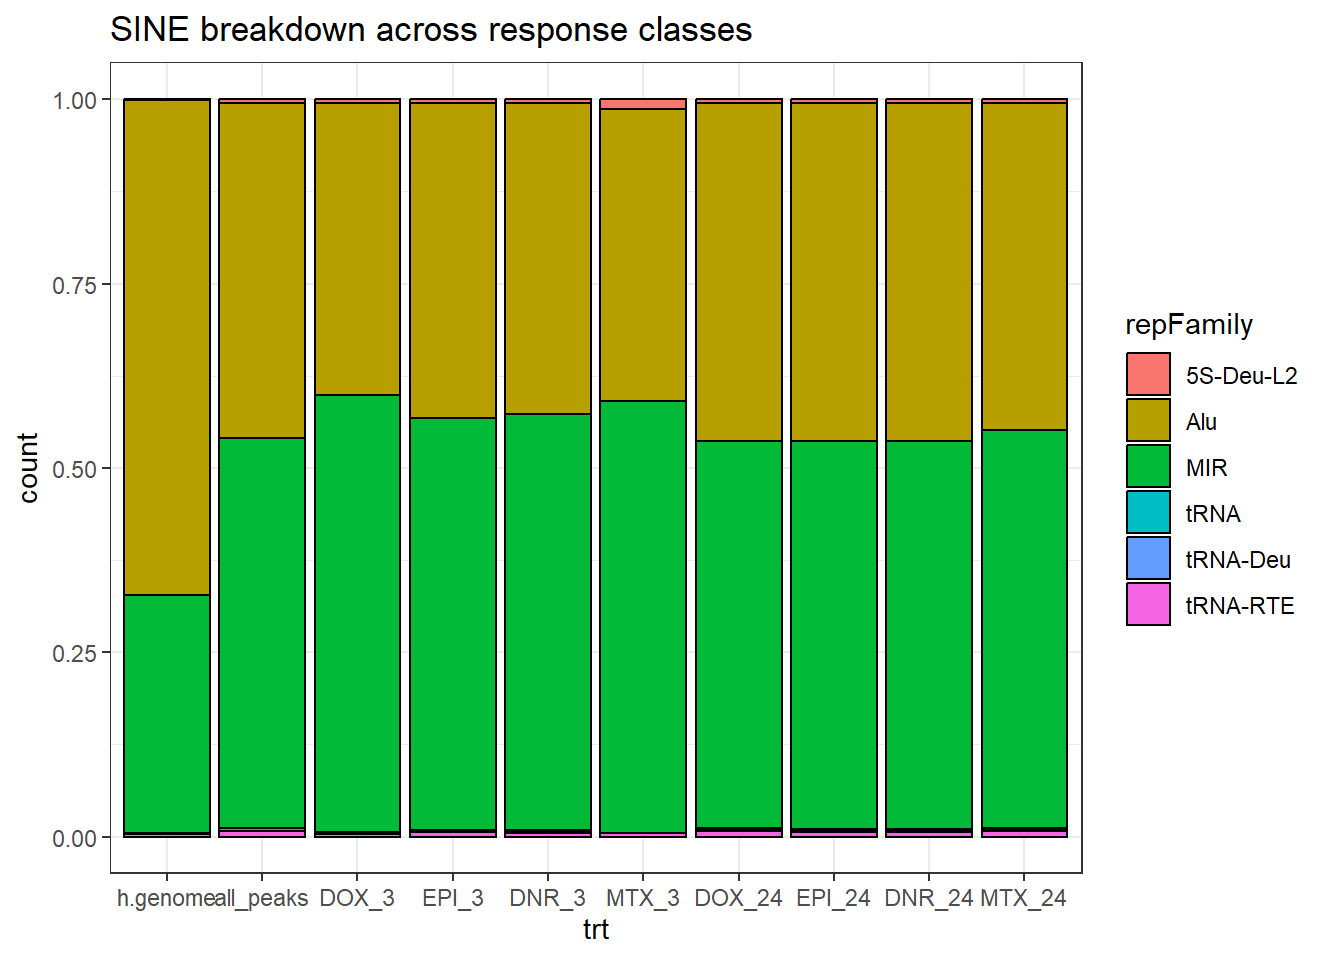
| Version | Author | Date |
|---|---|---|
| e7c389e | reneeisnowhere | 2025-07-23 |
# scale_fill_LINEs()Looking at enrichment of SINE families by treatment-time
MIR_overlaps <-
overlap_TE_gr %>%
  as.data.frame() %>%
  dplyr::filter(repClass=="SINE") %>%
  dplyr::select(Peakid,repName, repClass,repFamily) %>%
  group_by(Peakid) %>%
  reframe(repFamily= paste(unique(repFamily), collapse = ";"),
                             MIR_overlap=if_else("MIR" %in% repFamily, "MIR_peak","not_MIR_peak")) %>%
  left_join(annotated_peaks, by=c("Peakid"="genes"))
DOX_3_MIR <- MIR_overlaps %>%
group_by(MIR_overlap, DOX_sig_3) %>%
tally %>%
pivot_wider(id_cols= DOX_sig_3,names_from = MIR_overlap, values_from = n) %>%
column_to_rownames("DOX_sig_3")
DOX_3_MIR MIR_peak not_MIR_peak
sig 566 462
not_sig 20587 21179chisq.test(DOX_3_MIR)
    Pearson's Chi-squared test with Yates' continuity correction

data:  DOX_3_MIR
X-squared = 13.12, df = 1, p-value = 0.0002922
DOX_24_MIR <- MIR_overlaps %>%
group_by(MIR_overlap, DOX_sig_24) %>%
tally %>%
pivot_wider(id_cols= DOX_sig_24,names_from = MIR_overlap, values_from = n) %>%
column_to_rownames("DOX_sig_24")
DOX_24_MIR MIR_peak not_MIR_peak
sig 9359 9769
not_sig 11794 11872chisq.test(DOX_24_MIR)
    Pearson's Chi-squared test with Yates' continuity correction

data:  DOX_24_MIR
X-squared = 3.4446, df = 1, p-value = 0.06346
EPI_3_MIR <- MIR_overlaps %>%
group_by(MIR_overlap, EPI_sig_3) %>%
tally %>%
pivot_wider(id_cols= EPI_sig_3,names_from = MIR_overlap, values_from = n) %>%
column_to_rownames("EPI_sig_3")
EPI_3_MIR MIR_peak not_MIR_peak
sig 2185 2011
not_sig 18968 19630chisq.test(EPI_3_MIR)
    Pearson's Chi-squared test with Yates' continuity correction

data:  EPI_3_MIR
X-squared = 12.889, df = 1, p-value = 0.0003305
EPI_24_MIR <- MIR_overlaps %>%
group_by(MIR_overlap, EPI_sig_24) %>%
tally %>%
pivot_wider(id_cols= EPI_sig_24,names_from = MIR_overlap, values_from = n) %>%
column_to_rownames("EPI_sig_24")
EPI_24_MIR MIR_peak not_MIR_peak
sig 9482 9959
not_sig 11671 11682chisq.test(EPI_24_MIR)
    Pearson's Chi-squared test with Yates' continuity correction

data:  EPI_24_MIR
X-squared = 6.0966, df = 1, p-value = 0.01354
DNR_3_MIR <- MIR_overlaps %>%
group_by(MIR_overlap, DNR_sig_3) %>%
tally %>%
pivot_wider(id_cols= DNR_sig_3,names_from = MIR_overlap, values_from = n) %>%
column_to_rownames("DNR_sig_3")
DNR_3_MIR MIR_peak not_MIR_peak
sig 3411 3106
not_sig 17742 18535chisq.test(DNR_3_MIR)
    Pearson's Chi-squared test with Yates' continuity correction

data:  DNR_3_MIR
X-squared = 25.91, df = 1, p-value = 3.577e-07
DNR_24_MIR <- MIR_overlaps %>%
group_by(MIR_overlap, DNR_sig_24) %>%
tally %>%
pivot_wider(id_cols= DNR_sig_24,names_from = MIR_overlap, values_from = n) %>%
column_to_rownames("DNR_sig_24")
DNR_24_MIR MIR_peak not_MIR_peak
sig 11211 11708
not_sig 9942 9933chisq.test(DNR_24_MIR)
    Pearson's Chi-squared test with Yates' continuity correction

data:  DNR_24_MIR
X-squared = 5.1732, df = 1, p-value = 0.02294
MTX_3_MIR <- MIR_overlaps %>%
group_by(MIR_overlap, MTX_sig_3) %>%
tally %>%
pivot_wider(id_cols= MTX_sig_3,names_from = MIR_overlap, values_from = n) %>%
column_to_rownames("MTX_sig_3")
MTX_3_MIR MIR_peak not_MIR_peak
sig 121 99
not_sig 21032 21542chisq.test(MTX_3_MIR)
    Pearson's Chi-squared test with Yates' continuity correction

data:  MTX_3_MIR
X-squared = 2.5254, df = 1, p-value = 0.112
MTX_24_MIR <- MIR_overlaps %>%
group_by(MIR_overlap, MTX_sig_24) %>%
tally %>%
pivot_wider(id_cols= MTX_sig_24,names_from = MIR_overlap, values_from = n) %>%
column_to_rownames("MTX_sig_24")
MTX_24_MIR MIR_peak not_MIR_peak
sig 3580 3534
not_sig 17573 18107chisq.test(MTX_24_MIR)
    Pearson's Chi-squared test with Yates' continuity correction

data:  MTX_24_MIR
X-squared = 2.6822, df = 1, p-value = 0.1015
mir_tables <- c("DOX_3_MIR","DOX_24_MIR", "EPI_3_MIR","EPI_24_MIR", "DNR_3_MIR","DNR_24_MIR","MTX_3_MIR", "MTX_24_MIR")
## making a dataframe of chisquare pvalues
mir_pval_df <- data.frame(
Treatment_Time = mir_tables,
P_value = sapply(mir_tables, function(x) {
tbl <- get(x)
test_result <- chisq.test(tbl)
test_result$p.value
})
)
mir_pval_df <- mir_pval_df %>%
mutate(signif_label = case_when(
P_value < 0.001 ~ "***",
P_value < 0.01 ~ "**",
P_value < 0.05 ~ "*",
TRUE ~ "ns"
))
print(mir_pval_df) Treatment_Time P_value signif_label
DOX_3_MIR DOX_3_MIR 2.922131e-04 ***
DOX_24_MIR DOX_24_MIR 6.345823e-02 ns
EPI_3_MIR EPI_3_MIR 3.304638e-04 ***
EPI_24_MIR EPI_24_MIR 1.354414e-02 *
DNR_3_MIR DNR_3_MIR 3.576759e-07 ***
DNR_24_MIR DNR_24_MIR 2.293857e-02 *
MTX_3_MIR MTX_3_MIR 1.120257e-01 ns
MTX_24_MIR MTX_24_MIR 1.014728e-01 nsn <- length(mir_tables)
signif_df <- data.frame(
xmin = seq(1, by = 2, length.out = n),
xmax = seq(2, by = 2, length.out = n),
y_position = rep(1.05, n), # tweak if needed
annotation = mir_pval_df$signif_label,
Treatment_Time = mir_pval_df$Treatment_Time) %>%
mutate(Treatment_Time= factor(Treatment_Time, levels = c("DOX_3_MIR",
"DOX_24_MIR",
"EPI_3_MIR",
"EPI_24_MIR",
"DNR_3_MIR",
"DNR_24_MIR",
"MTX_3_MIR",
"MTX_24_MIR")))
signif_df$group <- 1:nrow(signif_df)
signif_df xmin xmax y_position annotation Treatment_Time group
1 1 2 1.05 *** DOX_3_MIR 1
2 3 4 1.05 ns DOX_24_MIR 2
3 5 6 1.05 *** EPI_3_MIR 3
4 7 8 1.05 * EPI_24_MIR 4
5 9 10 1.05 *** DNR_3_MIR 5
6 11 12 1.05 * DNR_24_MIR 6
7 13 14 1.05 ns MTX_3_MIR 7
8 15 16 1.05 ns MTX_24_MIR 8extract_mir_counts <- function(tbl_name) {
df <- get(tbl_name)
# Add significance labels (assuming row 1 = sig, row 2 = not sig)
df$Significance <- c("Significant", "Not_Significant")
# Reshape to long format
df_long <- df %>%
pivot_longer(cols = c("MIR_peak", "not_MIR_peak"),
names_to = "MIR_status",
values_to = "Count") %>%
mutate(Treatment_Time = tbl_name)
return(df_long)
}
# Combine all into one dataframe
mir_prop_df <- bind_rows(lapply(mir_tables, extract_mir_counts))
# Convert columns to factors
mir_prop_df$MIR_status <- factor(mir_prop_df$MIR_status, levels = c("MIR_peak", "not_MIR_peak"))
mir_prop_df$Significance <- factor(mir_prop_df$Significance, levels = c("Significant", "Not_Significant"))
# # Normalize to proportions
mir_prop_df <- mir_prop_df %>%
group_by(Treatment_Time, Significance) %>%
mutate(Proportion = Count / sum(Count)) %>%
ungroup() %>%
mutate(x_axis = interaction(Significance, Treatment_Time,
levels = c( # list levels in the exact plotting order
"Significant.DOX_3_MIR",
"Not_Significant.DOX_3_MIR",
"Significant.DOX_24_MIR",
"Not_Significant.DOX_24_MIR",
"Significant.EPI_3_MIR",
"Not_Significant.EPI_3_MIR",
"Significant.EPI_24_MIR",
"Not_Significant.EPI_24_MIR",
"Significant.DNR_3_MIR",
"Not_Significant.DNR_3_MIR",
"Significant.DNR_24_MIR",
"Not_Significant.DNR_24_MIR",
"Significant.MTX_3_MIR",
"Not_Significant.MTX_3_MIR",
"Significant.MTX_24_MIR",
"Not_Significant.MTX_24_MIR"
)))
mir_prop_df %>%
mutate(Treatment_Time= factor(Treatment_Time, levels = c("DOX_3_MIR",
"DOX_24_MIR",
"EPI_3_MIR",
"EPI_24_MIR",
"DNR_3_MIR",
"DNR_24_MIR",
"MTX_3_MIR",
"MTX_24_MIR"))) %>%
mutate(MIR_status=factor(MIR_status,levels=c("MIR_peak","not_MIR_peak")),
Significance=factor(Significance,levels = c("Significant","Not_Significant"))) %>%
ggplot(., aes(x=interaction(Significance,Treatment_Time), y=Proportion, fill=MIR_status))+
geom_bar(stat = "identity", position = "fill") +
scale_y_continuous(labels = scales::percent_format(), limits = c(0, 1.2)) +
scale_fill_manual(values = c("MIR_peak" = "cornflowerblue", "not_MIR_peak" = "darkblue")) +
labs(
title = "MIR vs not-MIR Peak Proportions Across Treatments",
x = "Treatment-Time",
y = "Proportion",
fill = "MIR Status"
) +
theme_bw() +
theme(axis.text.x = element_text(angle = 45, hjust = 1))# +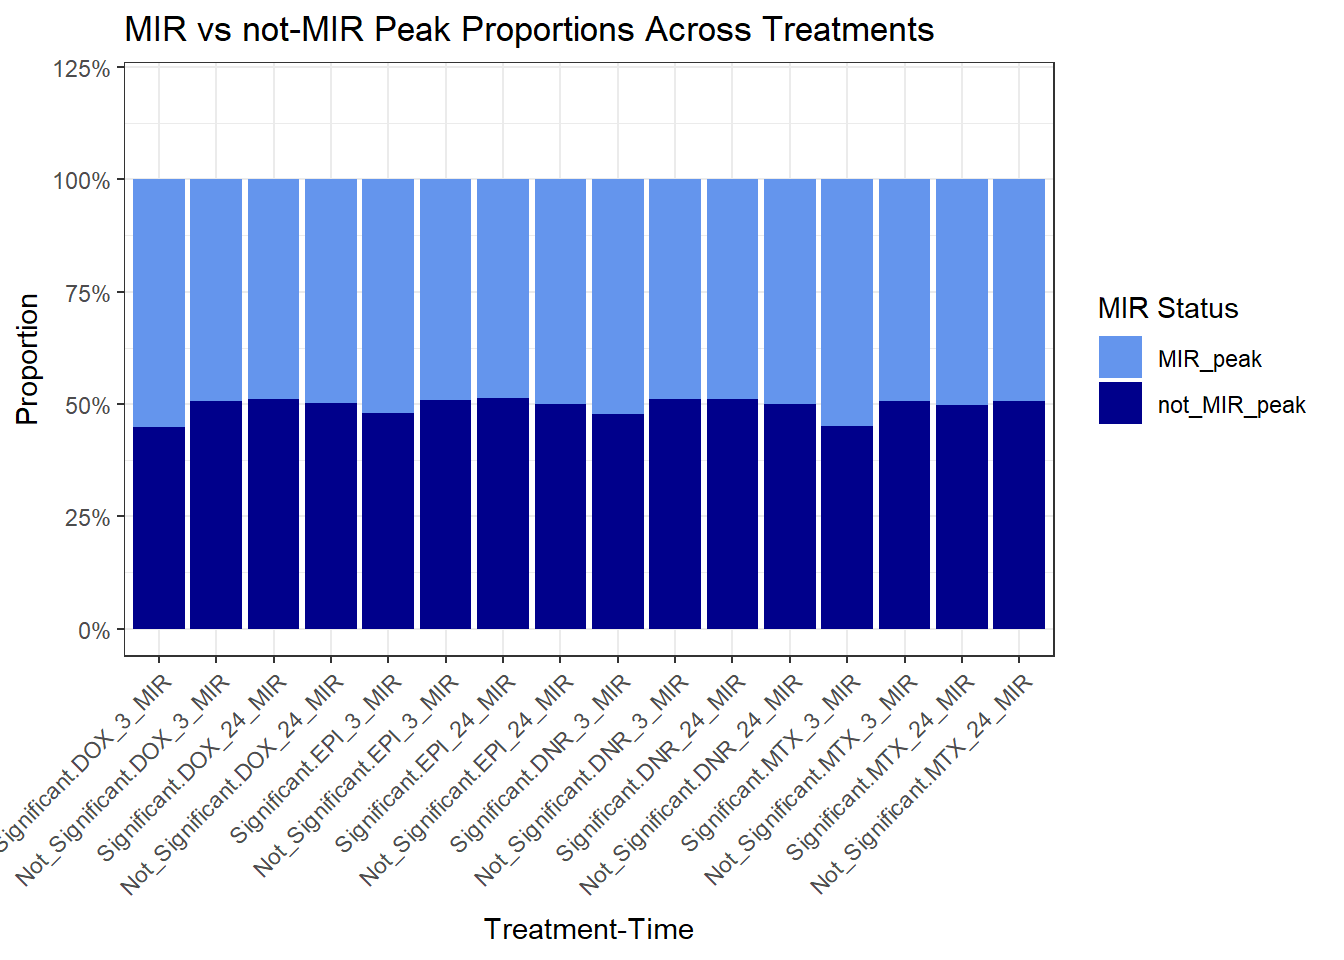
  geom_signif(data = signif_df,
              aes(xmin=xmin,
                  xmax=xmax,
                  annotations=annotation,
                  y_position=y_position,
                  group=group,
                  manual=TRUE,
                  tip_length = 0.03,
            inherit.aes = FALSE))
mapping: xmin = ~xmin, xmax = ~xmax, annotations = ~annotation, y_position = ~y_position, group = ~group, manual = TRUE, tip_length = 0.03, inherit.aes = FALSE
geom_signif: na.rm = FALSE, extend_line = 0, parse = FALSE, orientation = NA
stat_signif: na.rm = FALSE, comparisons = NULL, test = wilcox.test, test.args = NULL, annotations = NULL, map_signif_level = FALSE, y_position = NULL, xmin = NULL, xmax = NULL, margin_top = 0.05, step_increase = 0, tip_length = 0.03, manual = FALSE, orientation = NA
position_identity All_chromatin_MIR_overlaps <-
overlap_TE_gr %>%
as.data.frame() %>%
# dplyr::filter(repClass=="SINE") %>%
dplyr::select(Peakid,repName, repClass,repFamily) %>%
group_by(Peakid) %>%
reframe(repFamily= paste(unique(repFamily), collapse = ";"),
MIR_overlap=if_else("MIR" %in% repFamily, "MIR_peak","not_MIR_peak")) %>%
left_join(annotated_peaks, by=c("Peakid"="genes"))
MIR_annotated_peaks <- annotated_peaks %>%
left_join(All_chromatin_MIR_overlaps) %>%
mutate(MIR_overlap=if_else(is.na(MIR_overlap),"not_MIR_peak",MIR_overlap))All_DOX_3 <- MIR_annotated_peaks %>%
group_by(DOX_sig_3,MIR_overlap) %>%
tally() %>%
pivot_wider(id_cols=DOX_sig_3,values_from = n, names_from = MIR_overlap) %>%
column_to_rownames("DOX_sig_3")
chisq.test(All_DOX_3)
    Pearson's Chi-squared test with Yates' continuity correction

data:  All_DOX_3
X-squared = 9.1466, df = 1, p-value = 0.002492
All_DOX_24 <- MIR_annotated_peaks %>%
group_by(DOX_sig_24,MIR_overlap) %>%
tally() %>%
pivot_wider(id_cols=DOX_sig_24,values_from = n, names_from = MIR_overlap) %>%
column_to_rownames("DOX_sig_24")
chisq.test(All_DOX_24)
    Pearson's Chi-squared test with Yates' continuity correction

data:  All_DOX_24
X-squared = 24.708, df = 1, p-value = 6.672e-07
All_EPI_3 <- MIR_annotated_peaks %>%
group_by(EPI_sig_3,MIR_overlap) %>%
tally() %>%
pivot_wider(id_cols=EPI_sig_3,values_from = n, names_from = MIR_overlap) %>%
column_to_rownames("EPI_sig_3")
chisq.test(All_EPI_3)
    Pearson's Chi-squared test with Yates' continuity correction

data:  All_EPI_3
X-squared = 4.4293, df = 1, p-value = 0.03533
All_EPI_24 <- MIR_annotated_peaks %>%
group_by(EPI_sig_24,MIR_overlap) %>%
tally() %>%
pivot_wider(id_cols=EPI_sig_24,values_from = n, names_from = MIR_overlap) %>%
column_to_rownames("EPI_sig_24")
chisq.test(All_EPI_24)
    Pearson's Chi-squared test with Yates' continuity correction

data:  All_EPI_24
X-squared = 14.852, df = 1, p-value = 0.0001163
All_DNR_3 <- MIR_annotated_peaks %>%
group_by(DNR_sig_3,MIR_overlap) %>%
tally() %>%
pivot_wider(id_cols=DNR_sig_3,values_from = n, names_from = MIR_overlap) %>%
column_to_rownames("DNR_sig_3")
chisq.test(All_DNR_3)
    Pearson's Chi-squared test with Yates' continuity correction

data:  All_DNR_3
X-squared = 0.12188, df = 1, p-value = 0.727
All_DNR_24 <- MIR_annotated_peaks %>%
group_by(DNR_sig_24,MIR_overlap) %>%
tally() %>%
pivot_wider(id_cols=DNR_sig_24,values_from = n, names_from = MIR_overlap) %>%
column_to_rownames("DNR_sig_24")
chisq.test(All_DNR_24)
    Pearson's Chi-squared test with Yates' continuity correction

data:  All_DNR_24
X-squared = 3.2099, df = 1, p-value = 0.07319
All_MTX_3 <- MIR_annotated_peaks %>%
group_by(MTX_sig_3,MIR_overlap) %>%
tally() %>%
pivot_wider(id_cols=MTX_sig_3,values_from = n, names_from = MIR_overlap) %>%
column_to_rownames("MTX_sig_3")
chisq.test(All_MTX_3)
    Pearson's Chi-squared test with Yates' continuity correction

data:  All_MTX_3
X-squared = 0.023741, df = 1, p-value = 0.8775
All_MTX_24 <- MIR_annotated_peaks %>%
group_by(MTX_sig_24,MIR_overlap) %>%
tally() %>%
pivot_wider(id_cols=MTX_sig_24,values_from = n, names_from = MIR_overlap) %>%
column_to_rownames("MTX_sig_24")
chisq.test(All_MTX_24)
    Pearson's Chi-squared test with Yates' continuity correction

data:  All_MTX_24
X-squared = 4.136, df = 1, p-value = 0.04198
All_extract_mir_counts <- function(tbl_name) {
df <- get(tbl_name)
# Add significance labels (assuming row 1 = sig, row 2 = not sig)
df$Significance <- c("Significant", "Not_Significant")
# Reshape to long format
df_long <- df %>%
pivot_longer(cols = c("MIR_peak", "not_MIR_peak"),
names_to = "MIR_status",
values_to = "Count") %>%
mutate(Treatment_Time = tbl_name)
return(df_long)
}
All_mir_tables <- c("All_DOX_3","All_DOX_24", "All_EPI_3","All_EPI_24", "All_DNR_3","All_DNR_24","All_MTX_3", "All_MTX_24")
## making a dataframe of chisquare pvalues
All_mir_pval_df <- data.frame(
Treatment_Time = All_mir_tables,
P_value = sapply(All_mir_tables, function(x) {
tbl <- get(x)
test_result <- chisq.test(tbl)
test_result$p.value
})
)
All_mir_pval_df <- All_mir_pval_df %>%
mutate(signif_label = case_when(
P_value < 0.001 ~ "***",
P_value < 0.01 ~ "**",
P_value < 0.05 ~ "*",
TRUE ~ "ns"
))
print(All_mir_pval_df) Treatment_Time P_value signif_label
All_DOX_3 All_DOX_3 2.491859e-03 **
All_DOX_24 All_DOX_24 6.672248e-07 ***
All_EPI_3 All_EPI_3 3.532774e-02 *
All_EPI_24 All_EPI_24 1.162844e-04 ***
All_DNR_3 All_DNR_3 7.270015e-01 ns
All_DNR_24 All_DNR_24 7.319451e-02 ns
All_MTX_3 All_MTX_3 8.775459e-01 ns
All_MTX_24 All_MTX_24 4.198009e-02 *All_mir_prop_df <- bind_rows(lapply(All_mir_tables, All_extract_mir_counts))
All_mir_prop_df %>%
pivot_wider(id_cols = c(Treatment_Time,Significance), values_from = Count, names_from = MIR_status) %>%
left_join(All_mir_pval_df, by =c("Treatment_Time"= "Treatment_Time")) %>%
rowwise() %>%
mutate(prop=round((MIR_peak/sum(MIR_peak,not_MIR_peak))*100, 4)) %>%
DT::datatable()Third time’s the charm:
all_chrom_regions <- MIR_annotated_peaks %>%
  group_by(MIR_overlap) %>%
  tally %>%
  pivot_wider(names_from = MIR_overlap, values_from = n)

DOX_DAR_set_3 <- MIR_annotated_peaks %>%
  dplyr::filter(DOX_sig_3=="sig") %>%
   group_by(MIR_overlap) %>%
  tally %>%
  pivot_wider(names_from = MIR_overlap, values_from = n) %>%
  bind_rows(all_chrom_regions)
DOX_DAR_set_24 <- MIR_annotated_peaks %>%
  dplyr::filter(DOX_sig_24=="sig") %>%
   group_by(MIR_overlap) %>%
  tally %>%
  pivot_wider(names_from = MIR_overlap, values_from = n) %>%
  bind_rows(all_chrom_regions)


EPI_DAR_set_3 <- MIR_annotated_peaks %>%
  dplyr::filter(EPI_sig_3=="sig") %>%
   group_by(MIR_overlap) %>%
  tally %>%
  pivot_wider(names_from = MIR_overlap, values_from = n) %>%
  bind_rows(all_chrom_regions)
EPI_DAR_set_24 <- MIR_annotated_peaks %>%
  dplyr::filter(EPI_sig_24=="sig") %>%
   group_by(MIR_overlap) %>%
  tally %>%
  pivot_wider(names_from = MIR_overlap, values_from = n) %>%
  bind_rows(all_chrom_regions)

DNR_DAR_set_3 <- MIR_annotated_peaks %>%
  dplyr::filter(DNR_sig_3=="sig") %>%
   group_by(MIR_overlap) %>%
  tally %>%
  pivot_wider(names_from = MIR_overlap, values_from = n) %>%
  bind_rows(all_chrom_regions)
DNR_DAR_set_24 <- MIR_annotated_peaks %>%
  dplyr::filter(DNR_sig_24=="sig") %>%
   group_by(MIR_overlap) %>%
  tally %>%
  pivot_wider(names_from = MIR_overlap, values_from = n) %>%
  bind_rows(all_chrom_regions)

MTX_DAR_set_3 <- MIR_annotated_peaks %>%
  dplyr::filter(MTX_sig_3=="sig") %>%
   group_by(MIR_overlap) %>%
  tally %>%
  pivot_wider(names_from = MIR_overlap, values_from = n) %>%
  bind_rows(all_chrom_regions)
MTX_DAR_set_24 <- MIR_annotated_peaks %>%
  dplyr::filter(MTX_sig_24=="sig") %>%
   group_by(MIR_overlap) %>%
  tally %>%
  pivot_wider(names_from = MIR_overlap, values_from = n) %>%
  bind_rows(all_chrom_regions)
now to collect dataframes and do chisquare test:
All_extract_DAR_AR_counts <- function(tbl_name) {
  df <- get(tbl_name)

  # Add significance labels (assuming row 1 = sig, row 2 = not sig)
  df$type <- c("DAR", "AR")

  # Reshape to long format
  df_long <- df %>%
    pivot_longer(cols = c("MIR_peak", "not_MIR_peak"),
                 names_to = "MIR_status",
                 values_to = "Count") %>%
    mutate(Treatment_Time = tbl_name)

  return(df_long)
}

All_DAR_AR_tables <- c("DOX_DAR_set_3","DOX_DAR_set_24", "EPI_DAR_set_3","EPI_DAR_set_24", "DNR_DAR_set_3","DNR_DAR_set_24","MTX_DAR_set_3", "MTX_DAR_set_24")
## making a dataframe of chisquare pvalues
All_DAR_AR_pval_df <- data.frame(
  Treatment_Time = All_DAR_AR_tables,
  P_value = sapply(All_DAR_AR_tables, function(x) {
    tbl <- get(x)
    test_result <- chisq.test(tbl)
    test_result$p.value
  })
)
All_DAR_AR_pval_df <- All_DAR_AR_pval_df %>%
  mutate(signif_label = case_when(
    P_value < 0.001 ~ "***",
    P_value < 0.01  ~ "**",
    P_value < 0.05  ~ "*",
    TRUE            ~ "ns"
  ))

All_DAR_AR_pval_df
Treatment_Time P_value signif_label
DOX_DAR_set_3 DOX_DAR_set_3 0.003162900 **
DOX_DAR_set_24 DOX_DAR_set_24 0.001554412 **
EPI_DAR_set_3 EPI_DAR_set_3 0.055590616 ns
EPI_DAR_set_24 EPI_DAR_set_24 0.015327317 *
DNR_DAR_set_3 DNR_DAR_set_3 0.764594537 ns
DNR_DAR_set_24 DNR_DAR_set_24 0.312765832 ns
MTX_DAR_set_3 MTX_DAR_set_3 0.878454254 ns
MTX_DAR_set_24 MTX_DAR_set_24 0.083352413 nsAll_DAR_AR_prop_df <- bind_rows(lapply(All_DAR_AR_tables, All_extract_DAR_AR_counts))
All_DAR_AR_prop_df %>%
pivot_wider(id_cols = c(Treatment_Time,type), values_from = Count, names_from = MIR_status) %>%
left_join(All_DAR_AR_pval_df, by =c("Treatment_Time"= "Treatment_Time")) %>%
rowwise() %>%
mutate(prop=round((MIR_peak/sum(MIR_peak,not_MIR_peak))*100, 4)) %>%
DT::datatable()Fourth time, this time only SINEs
all_chrom_regions_so <- MIR_annotated_peaks %>%
  dplyr::filter(SINE_status=="SINE_peak") %>%
  group_by(MIR_overlap) %>%
  tally %>%
  pivot_wider(names_from = MIR_overlap, values_from = n)

DOX_DAR_set_3_so <- MIR_annotated_peaks %>%
   dplyr::filter(SINE_status=="SINE_peak") %>%
  dplyr::filter(DOX_sig_3=="sig") %>%
   group_by(MIR_overlap) %>%
  tally %>%
  pivot_wider(names_from = MIR_overlap, values_from = n) %>%
  bind_rows(all_chrom_regions_so)
DOX_DAR_set_24_so <- MIR_annotated_peaks %>%
   dplyr::filter(SINE_status=="SINE_peak") %>%
  dplyr::filter(DOX_sig_24=="sig") %>%
   group_by(MIR_overlap) %>%
  tally %>%
  pivot_wider(names_from = MIR_overlap, values_from = n) %>%
  bind_rows(all_chrom_regions_so)


EPI_DAR_set_3_so <- MIR_annotated_peaks %>%
   dplyr::filter(SINE_status=="SINE_peak") %>%
  dplyr::filter(EPI_sig_3=="sig") %>%
   group_by(MIR_overlap) %>%
  tally %>%
  pivot_wider(names_from = MIR_overlap, values_from = n) %>%
  bind_rows(all_chrom_regions_so)
EPI_DAR_set_24_so <- MIR_annotated_peaks %>%
   dplyr::filter(SINE_status=="SINE_peak") %>%
  dplyr::filter(EPI_sig_24=="sig") %>%
   group_by(MIR_overlap) %>%
  tally %>%
  pivot_wider(names_from = MIR_overlap, values_from = n) %>%
  bind_rows(all_chrom_regions_so)

DNR_DAR_set_3_so <- MIR_annotated_peaks %>%
   dplyr::filter(SINE_status=="SINE_peak") %>%
  dplyr::filter(DNR_sig_3=="sig") %>%
   group_by(MIR_overlap) %>%
  tally %>%
  pivot_wider(names_from = MIR_overlap, values_from = n) %>%
  bind_rows(all_chrom_regions_so)
DNR_DAR_set_24_so <- MIR_annotated_peaks %>%
   dplyr::filter(SINE_status=="SINE_peak") %>%
  dplyr::filter(DNR_sig_24=="sig") %>%
   group_by(MIR_overlap) %>%
  tally %>%
  pivot_wider(names_from = MIR_overlap, values_from = n) %>%
  bind_rows(all_chrom_regions_so)

MTX_DAR_set_3_so <- MIR_annotated_peaks %>%
   dplyr::filter(SINE_status=="SINE_peak") %>%
  dplyr::filter(MTX_sig_3=="sig") %>%
   group_by(MIR_overlap) %>%
  tally %>%
  pivot_wider(names_from = MIR_overlap, values_from = n) %>%
  bind_rows(all_chrom_regions_so)
MTX_DAR_set_24_so <- MIR_annotated_peaks %>%
   dplyr::filter(SINE_status=="SINE_peak") %>%
  dplyr::filter(MTX_sig_24=="sig") %>%
   group_by(MIR_overlap) %>%
  tally %>%
  pivot_wider(names_from = MIR_overlap, values_from = n) %>%
  bind_rows(all_chrom_regions_so)
All_extract_DAR_AR_counts_so <- function(tbl_name) {
df <- get(tbl_name)
# Add significance labels (assuming row 1 = sig, row 2 = not sig)
df$type <- c("DAR", "AR")
# Reshape to long format
df_long <- df %>%
pivot_longer(cols = c("MIR_peak", "not_MIR_peak"),
names_to = "MIR_status",
values_to = "Count") %>%
mutate(Treatment_Time = tbl_name)
return(df_long)
}
All_DAR_AR_tables_so <- c("DOX_DAR_set_3_so","DOX_DAR_set_24_so", "EPI_DAR_set_3_so","EPI_DAR_set_24_so", "DNR_DAR_set_3_so","DNR_DAR_set_24_so","MTX_DAR_set_3_so", "MTX_DAR_set_24_so")
## making a dataframe of chisquare pvalues
All_DAR_AR_pval_df_so <- data.frame(
Treatment_Time = All_DAR_AR_tables_so,
P_value = sapply(All_DAR_AR_tables_so, function(x) {
tbl <- get(x)
test_result <- chisq.test(tbl)
test_result$p.value
})
)
All_DAR_AR_pval_df_so <- All_DAR_AR_pval_df_so %>%
mutate(signif_label = case_when(
P_value < 0.001 ~ "***",
P_value < 0.01 ~ "**",
P_value < 0.05 ~ "*",
TRUE ~ "ns"
))
All_DAR_AR_pval_df_so Treatment_Time P_value signif_label
DOX_DAR_set_3_so DOX_DAR_set_3_so 0.06453621 ns
DOX_DAR_set_24_so DOX_DAR_set_24_so 0.20229654 ns
EPI_DAR_set_3_so EPI_DAR_set_3_so 0.70044059 ns
EPI_DAR_set_24_so EPI_DAR_set_24_so 0.13964838 ns
DNR_DAR_set_3_so DNR_DAR_set_3_so 0.14100716 ns
DNR_DAR_set_24_so DNR_DAR_set_24_so 0.06816154 ns
MTX_DAR_set_3_so MTX_DAR_set_3_so 0.82535440 ns
MTX_DAR_set_24_so MTX_DAR_set_24_so 0.30147018 nsAll_DAR_AR_prop_df_so <- bind_rows(lapply(All_DAR_AR_tables_so, All_extract_DAR_AR_counts_so))
All_DAR_AR_prop_df_so %>%
pivot_wider(id_cols = c(Treatment_Time,type), values_from = Count, names_from = MIR_status) %>%
left_join(All_DAR_AR_pval_df_so, by =c("Treatment_Time"= "Treatment_Time")) %>%
rowwise() %>%
mutate(prop=round((MIR_peak/sum(MIR_peak,not_MIR_peak))*100, 4)) %>%
DT::datatable()sine data
Overlapping_peaks <-
  overlap_TE_gr %>%
  as.data.frame() %>%
  dplyr::filter(repFamily=="MIR"|
                  repFamily=="Alu"|
                  repFamily=="L1"|
                  repFamily=="L2"|
                  repFamily=="ERVK"|
                  repFamily=="ERV1"|
                  repFamily=="ERVL-MaLR"|
                  repFamily=="TcMar"|
                  repFamily=="hAT")

Family_list <- c("MIR",
                  "Alu",
                  "L1",
                  "L2",
                  "ERVK",
                  "ERV1",
                  "ERVL-MaLR",
                  "TcMar",
                  "hAT")

# Convert once to avoid repeating
df <- as.data.frame(overlap_TE_gr)

# Use a list to store them
peak_lists <- lapply(Family_list, function(fam) {
  df %>%
    dplyr::filter(repFamily == fam | repClass == fam) %>%
    dplyr::distinct(Peakid)
})

# Name each element
names(peak_lists) <- paste0(Family_list, "_peaks")
all_filt <- all_results %>%
dplyr::filter(source %in% c("DOX_3", "DOX_24")) %>%
dplyr::select(source, genes, logFC, adj.P.Val) %>%
tidyr::pivot_wider(id_cols = genes, names_from = source, values_from = c(logFC, adj.P.Val)) %>%
mutate(
TE_status = if_else(genes %in% TE_peaks$Peakid, "TE_peak", "not_TE_peak"),
MIR_status = if_else(genes %in% peak_lists$MIR_peaks$Peakid, "MIR_peak", "not_MIR_peak"),
Alu_status = if_else(genes %in% peak_lists$Alu_peaks$Peakid, "Alu_peak", "not_Alu_peak"),
L1_status = if_else(genes %in% peak_lists$L1_peaks$Peakid, "L1_peak", "not_L1_peak"),
L2_status = if_else(genes %in% peak_lists$L2_peaks$Peakid, "L2_peak", "not_L2_peak"),
ERVK_status = if_else(genes %in% peak_lists$ERVK_peaks$Peakid, "ERVK_peak", "not_ERVK_peak"),
ERV1_status = if_else(genes %in% peak_lists$ERV1_peaks$Peakid, "ERV1_peak", "not_ERV1_peak"),
`ERVL-MaLR_status` = if_else(genes %in% peak_lists$`ERVL-MaLR_peaks`$Peakid, "ERVL-MaLR_peak", "not_ERVL-MaLR_peak"),
TcMar_status = if_else(genes %in% peak_lists$TcMar_peaks$Peakid, "TcMar_peak", "not_TcMar_peak"),
hAT_status = if_else(genes %in% peak_lists$hAT_peaks_peaks$Peakid, "hAT_peak", "not_hAT_peak")) %>%
mutate(DOX_sig_3=if_else(adj.P.Val_DOX_3<0.05,"sig","not_sig"),
DOX_sig_24=if_else(adj.P.Val_DOX_24<0.05,"sig","not_sig")) %>%
mutate(DOX_sig_3=factor(DOX_sig_3,levels=c("sig","not_sig")),
DOX_sig_24=factor(DOX_sig_24,levels=c("sig","not_sig"))) %>%
left_join(.,my_EPI_data,by=c("genes"="genes")) %>%
mutate(EPI_sig_3=if_else(adj.P.Val_EPI_3<0.05,"sig","not_sig"),
EPI_sig_24=if_else(adj.P.Val_EPI_24<0.05,"sig","not_sig")) %>%
mutate(EPI_sig_3=factor(EPI_sig_3,levels=c("sig","not_sig")),
EPI_sig_24=factor(EPI_sig_24,levels=c("sig","not_sig"))) %>%
left_join(.,my_DNR_data,by=c("genes"="genes")) %>%
mutate(DNR_sig_3=if_else(adj.P.Val_DNR_3<0.05,"sig","not_sig"),
DNR_sig_24=if_else(adj.P.Val_DNR_24<0.05,"sig","not_sig")) %>%
mutate(DNR_sig_3=factor(DNR_sig_3,levels=c("sig","not_sig")),
DNR_sig_24=factor(DNR_sig_24,levels=c("sig","not_sig"))) %>%
left_join(.,my_MTX_data,by=c("genes"="genes")) %>%
mutate(MTX_sig_3=if_else(adj.P.Val_MTX_3<0.05,"sig","not_sig"),
MTX_sig_24=if_else(adj.P.Val_MTX_24<0.05,"sig","not_sig")) %>%
mutate(MTX_sig_3=factor(MTX_sig_3,levels=c("sig","not_sig")),
MTX_sig_24=factor(MTX_sig_24,levels=c("sig","not_sig"))) DOX all
# Vector of status-type column names in your data
status_columns <- c("MIR_status",
                  "Alu_status",
                  "L1_status",
                  "L2_status",
                  "ERVK_status",
                  "ERV1_status",
                  "ERVL-MaLR_status",
                  "TcMar_status",
                  "hAT_status")

# Create a list of matrices, named by status type
DOX_3_status_filt_matrices <- map(status_columns, function(status_col) {
  # Extract prefix (e.g., "TE", "SINE") from column name like "TE_status"
  prefix <- sub("_status$", "", status_col)
  expected_rows <- c(paste0(prefix, "_peak"), paste0("not_", prefix, "_peak"))
  expected_cols <- c("sig", "not_sig")

  # Build matrix
  mat <- all_filt %>%
    group_by(across(all_of(status_col)), DOX_sig_3) %>%
    tally() %>%
    pivot_wider(
      names_from = DOX_sig_3,
      values_from = n,
      values_fill = list(n = 0)
    ) %>%
    column_to_rownames(var = status_col) %>%
    as.matrix()
   print(mat)

  # Fill missing expected rows
  for (r in setdiff(expected_rows, rownames(mat))) {
    mat <- rbind(mat, setNames(rep(0, length(expected_cols)), expected_cols))
    rownames(mat)[nrow(mat)] <- r
  }

  # Fill missing expected columns
  for (c in setdiff(expected_cols, colnames(mat))) {
    mat <- cbind(mat, setNames(rep(0, nrow(mat)), c))
  }

  # Order
  mat <- mat[expected_rows, expected_cols, drop = FALSE]
})
sig not_sig
MIR_peak 648 23586
not_MIR_peak 2825 128498
sig not_sig
Alu_peak 451 20480
not_Alu_peak 3022 131604
sig not_sig
L1_peak 224 11618
not_L1_peak 3249 140466
sig not_sig
L2_peak 496 19200
not_L2_peak 2977 132884
sig not_sig
ERVK_peak 7 695
not_ERVK_peak 3466 151389
sig not_sig
ERV1_peak 125 5969
not_ERV1_peak 3348 146115
sig not_sig
ERVL-MaLR_peak 184 9210
not_ERVL-MaLR_peak 3289 142874
not_sig sig
TcMar_peak 3 0
not_TcMar_peak 152081 3473
sig not_sig
not_hAT_peak 3473 152084# Set names so you can easily refer to each status
names(DOX_3_status_filt_matrices) <- status_columns
odds_ratio_results_filt_DOX_3<- map(DOX_3_status_filt_matrices, function(mat) {
if (!all(dim(mat) == c(2, 2))) return(NULL)
result <- epitools::oddsratio(mat, method = "wald")
or <- result$measure[2, "estimate"]
lower <- result$measure[2, "lower"]
upper <- result$measure[2, "upper"]
pval_chisq <- if("chi.square" %in% colnames(result$p.value) && nrow(result$p.value) >= 2) {
result$p.value[2, "chi.square"]
} else {
NA_real_
}
list(
odds_ratio = or,
lower_ci = lower,
upper_ci = upper,
chi_sq_p = pval_chisq
)
})# Vector of status-type column names in your data
status_columns <- c("MIR_status",
"Alu_status",
"L1_status",
"L2_status",
"ERVK_status",
"ERV1_status",
"ERVL-MaLR_status",
"TcMar_status",
"hAT_status")
# Create a list of matrices, named by status type
DOX_24_status_filt_matrices <- map(status_columns, function(status_col) {
# Extract prefix (e.g., "TE", "SINE") from column name like "TE_status"
prefix <- sub("_status$", "", status_col)
expected_rows <- c(paste0(prefix, "_peak"), paste0("not_", prefix, "_peak"))
expected_cols <- c("sig", "not_sig")
# Build matrix
mat <- all_filt %>%
group_by(across(all_of(status_col)), DOX_sig_24) %>%
tally() %>%
pivot_wider(
names_from = DOX_sig_24,
values_from = n,
values_fill = list(n = 0)
) %>%
column_to_rownames(var = status_col) %>%
as.matrix()
print(mat)
# Fill missing expected rows
for (r in setdiff(expected_rows, rownames(mat))) {
mat <- rbind(mat, setNames(rep(0, length(expected_cols)), expected_cols))
rownames(mat)[nrow(mat)] <- r
}
# Fill missing expected columns
for (c in setdiff(expected_cols, colnames(mat))) {
mat <- cbind(mat, setNames(rep(0, nrow(mat)), c))
}
# Order
mat <- mat[expected_rows, expected_cols, drop = FALSE]
}) sig not_sig
MIR_peak 10792 13442
not_MIR_peak 54028 77295
sig not_sig
Alu_peak 9450 11481
not_Alu_peak 55370 79256
sig not_sig
L1_peak 5031 6811
not_L1_peak 59789 83926
sig not_sig
L2_peak 8976 10720
not_L2_peak 55844 80017
sig not_sig
ERVK_peak 202 500
not_ERVK_peak 64618 90237
sig not_sig
ERV1_peak 2587 3507
not_ERV1_peak 62233 87230
sig not_sig
ERVL-MaLR_peak 4418 4976
not_ERVL-MaLR_peak 60402 85761
sig not_sig
TcMar_peak 2 1
not_TcMar_peak 64818 90736
sig not_sig
not_hAT_peak 64820 90737# Set names so you can easily refer to each status
names(DOX_3_status_filt_matrices) <- status_columns
odds_ratio_results_filt_DOX_24<- map(DOX_24_status_filt_matrices, function(mat) {
if (!all(dim(mat) == c(2, 2))) return(NULL)
result <- epitools::oddsratio(mat, method = "wald")
or <- result$measure[2, "estimate"]
lower <- result$measure[2, "lower"]
upper <- result$measure[2, "upper"]
pval_chisq <- if("chi.square" %in% colnames(result$p.value) && nrow(result$p.value) >= 2) {
result$p.value[2, "chi.square"]
} else {
NA_real_
}
list(
odds_ratio = or,
lower_ci = lower,
upper_ci = upper,
chi_sq_p = pval_chisq
)
})EPI all
# Vector of status-type column names in your data
status_columns <- c("MIR_status",
                  "Alu_status",
                  "L1_status",
                  "L2_status",
                  "ERVK_status",
                  "ERV1_status",
                  "ERVL-MaLR_status",
                  "TcMar_status",
                  "hAT_status")

# Create a list of matrices, named by status type
EPI_3_status_filt_matrices <- map(status_columns, function(status_col) {
  # Extract prefix (e.g., "TE", "SINE") from column name like "TE_status"
  prefix <- sub("_status$", "", status_col)
  expected_rows <- c(paste0(prefix, "_peak"), paste0("not_", prefix, "_peak"))
  expected_cols <- c("sig", "not_sig")

  # Build matrix
  mat <- all_filt %>%
    group_by(across(all_of(status_col)), EPI_sig_3) %>%
    tally() %>%
    pivot_wider(
      names_from = EPI_sig_3,
      values_from = n,
      values_fill = list(n = 0)
    ) %>%
    column_to_rownames(var = status_col) %>%
    as.matrix()
   print(mat)

  # Fill missing expected rows
  for (r in setdiff(expected_rows, rownames(mat))) {
    mat <- rbind(mat, setNames(rep(0, length(expected_cols)), expected_cols))
    rownames(mat)[nrow(mat)] <- r
  }

  # Fill missing expected columns
  for (c in setdiff(expected_cols, colnames(mat))) {
    mat <- cbind(mat, setNames(rep(0, nrow(mat)), c))
  }

  # Order
  mat <- mat[expected_rows, expected_cols, drop = FALSE]
})
sig not_sig
MIR_peak 2537 21697
not_MIR_peak 11697 119626
sig not_sig
Alu_peak 1952 18979
not_Alu_peak 12282 122344
sig not_sig
L1_peak 902 10940
not_L1_peak 13332 130383
sig not_sig
L2_peak 1904 17792
not_L2_peak 12330 123531
sig not_sig
ERVK_peak 48 654
not_ERVK_peak 14186 140669
sig not_sig
ERV1_peak 464 5630
not_ERV1_peak 13770 135693
sig not_sig
ERVL-MaLR_peak 646 8748
not_ERVL-MaLR_peak 13588 132575
not_sig sig
TcMar_peak 3 0
not_TcMar_peak 141320 14234
sig not_sig
not_hAT_peak 14234 141323# Set names so you can easily refer to each status
names(EPI_3_status_filt_matrices) <- status_columns
odds_ratio_results_filt_EPI_3<- map(EPI_3_status_filt_matrices, function(mat) {
if (!all(dim(mat) == c(2, 2))) return(NULL)
result <- epitools::oddsratio(mat, method = "wald")
or <- result$measure[2, "estimate"]
lower <- result$measure[2, "lower"]
upper <- result$measure[2, "upper"]
pval_chisq <- if("chi.square" %in% colnames(result$p.value) && nrow(result$p.value) >= 2) {
result$p.value[2, "chi.square"]
} else {
NA_real_
}
list(
odds_ratio = or,
lower_ci = lower,
upper_ci = upper,
chi_sq_p = pval_chisq
)
})# Vector of status-type column names in your data
status_columns <- c("MIR_status",
"Alu_status",
"L1_status",
"L2_status",
"ERVK_status",
"ERV1_status",
"ERVL-MaLR_status",
"TcMar_status",
"hAT_status")
# Create a list of matrices, named by status type
EPI_24_status_filt_matrices <- map(status_columns, function(status_col) {
# Extract prefix (e.g., "TE", "SINE") from column name like "TE_status"
prefix <- sub("_status$", "", status_col)
expected_rows <- c(paste0(prefix, "_peak"), paste0("not_", prefix, "_peak"))
expected_cols <- c("sig", "not_sig")
# Build matrix
mat <- all_filt %>%
group_by(across(all_of(status_col)), EPI_sig_24) %>%
tally() %>%
pivot_wider(
names_from = EPI_sig_24,
values_from = n,
values_fill = list(n = 0)
) %>%
column_to_rownames(var = status_col) %>%
as.matrix()
print(mat)
# Fill missing expected rows
for (r in setdiff(expected_rows, rownames(mat))) {
mat <- rbind(mat, setNames(rep(0, length(expected_cols)), expected_cols))
rownames(mat)[nrow(mat)] <- r
}
# Fill missing expected columns
for (c in setdiff(expected_cols, colnames(mat))) {
mat <- cbind(mat, setNames(rep(0, nrow(mat)), c))
}
# Order
mat <- mat[expected_rows, expected_cols, drop = FALSE]
}) sig not_sig
MIR_peak 10920 13314
not_MIR_peak 55581 75742
sig not_sig
Alu_peak 9630 11301
not_Alu_peak 56871 77755
sig not_sig
L1_peak 5189 6653
not_L1_peak 61312 82403
sig not_sig
L2_peak 9120 10576
not_L2_peak 57381 78480
sig not_sig
ERVK_peak 204 498
not_ERVK_peak 66297 88558
sig not_sig
ERV1_peak 2651 3443
not_ERV1_peak 63850 85613
sig not_sig
ERVL-MaLR_peak 4533 4861
not_ERVL-MaLR_peak 61968 84195
sig not_sig
TcMar_peak 1 2
not_TcMar_peak 66500 89054
sig not_sig
not_hAT_peak 66501 89056# Set names so you can easily refer to each status
names(EPI_3_status_filt_matrices) <- status_columns
odds_ratio_results_filt_EPI_24<- map(EPI_24_status_filt_matrices, function(mat) {
if (!all(dim(mat) == c(2, 2))) return(NULL)
result <- epitools::oddsratio(mat, method = "wald")
or <- result$measure[2, "estimate"]
lower <- result$measure[2, "lower"]
upper <- result$measure[2, "upper"]
pval_chisq <- if("chi.square" %in% colnames(result$p.value) && nrow(result$p.value) >= 2) {
result$p.value[2, "chi.square"]
} else {
NA_real_
}
list(
odds_ratio = or,
lower_ci = lower,
upper_ci = upper,
chi_sq_p = pval_chisq
)
})DNR all
# Vector of status-type column names in your data
status_columns <- c("MIR_status",
                  "Alu_status",
                  "L1_status",
                  "L2_status",
                  "ERVK_status",
                  "ERV1_status",
                  "ERVL-MaLR_status",
                  "TcMar_status",
                  "hAT_status")

# Create a list of matrices, named by status type
DNR_3_status_filt_matrices <- map(status_columns, function(status_col) {
  # Extract prefix (e.g., "TE", "SINE") from column name like "TE_status"
  prefix <- sub("_status$", "", status_col)
  expected_rows <- c(paste0(prefix, "_peak"), paste0("not_", prefix, "_peak"))
  expected_cols <- c("sig", "not_sig")

  # Build matrix
  mat <- all_filt %>%
    group_by(across(all_of(status_col)), DNR_sig_3) %>%
    tally() %>%
    pivot_wider(
      names_from = DNR_sig_3,
      values_from = n,
      values_fill = list(n = 0)
    ) %>%
    column_to_rownames(var = status_col) %>%
    as.matrix()
   print(mat)

  # Fill missing expected rows
  for (r in setdiff(expected_rows, rownames(mat))) {
    mat <- rbind(mat, setNames(rep(0, length(expected_cols)), expected_cols))
    rownames(mat)[nrow(mat)] <- r
  }

  # Fill missing expected columns
  for (c in setdiff(expected_cols, colnames(mat))) {
    mat <- cbind(mat, setNames(rep(0, nrow(mat)), c))
  }

  # Order
  mat <- mat[expected_rows, expected_cols, drop = FALSE]
})
sig not_sig
MIR_peak 3957 20277
not_MIR_peak 18781 112542
sig not_sig
Alu_peak 3016 17915
not_Alu_peak 19722 114904
sig not_sig
L1_peak 1405 10437
not_L1_peak 21333 122382
sig not_sig
L2_peak 2885 16811
not_L2_peak 19853 116008
sig not_sig
ERVK_peak 73 629
not_ERVK_peak 22665 132190
sig not_sig
ERV1_peak 718 5376
not_ERV1_peak 22020 127443
sig not_sig
ERVL-MaLR_peak 1047 8347
not_ERVL-MaLR_peak 21691 124472
not_sig sig
TcMar_peak 3 0
not_TcMar_peak 132816 22738
sig not_sig
not_hAT_peak 22738 132819# Set names so you can easily refer to each status
names(DNR_3_status_filt_matrices) <- status_columns
odds_ratio_results_filt_DNR_3<- map(DNR_3_status_filt_matrices, function(mat) {
if (!all(dim(mat) == c(2, 2))) return(NULL)
result <- epitools::oddsratio(mat, method = "wald")
or <- result$measure[2, "estimate"]
lower <- result$measure[2, "lower"]
upper <- result$measure[2, "upper"]
pval_chisq <- if("chi.square" %in% colnames(result$p.value) && nrow(result$p.value) >= 2) {
result$p.value[2, "chi.square"]
} else {
NA_real_
}
list(
odds_ratio = or,
lower_ci = lower,
upper_ci = upper,
chi_sq_p = pval_chisq
)
})# Vector of status-type column names in your data
status_columns <- c("MIR_status",
"Alu_status",
"L1_status",
"L2_status",
"ERVK_status",
"ERV1_status",
"ERVL-MaLR_status",
"TcMar_status",
"hAT_status")
# Create a list of matrices, named by status type
DNR_24_status_filt_matrices <- map(status_columns, function(status_col) {
# Extract prefix (e.g., "TE", "SINE") from column name like "TE_status"
prefix <- sub("_status$", "", status_col)
expected_rows <- c(paste0(prefix, "_peak"), paste0("not_", prefix, "_peak"))
expected_cols <- c("sig", "not_sig")
# Build matrix
mat <- all_filt %>%
group_by(across(all_of(status_col)), DNR_sig_24) %>%
tally() %>%
pivot_wider(
names_from = DNR_sig_24,
values_from = n,
values_fill = list(n = 0)
) %>%
column_to_rownames(var = status_col) %>%
as.matrix()
print(mat)
# Fill missing expected rows
for (r in setdiff(expected_rows, rownames(mat))) {
mat <- rbind(mat, setNames(rep(0, length(expected_cols)), expected_cols))
rownames(mat)[nrow(mat)] <- r
}
# Fill missing expected columns
for (c in setdiff(expected_cols, colnames(mat))) {
mat <- cbind(mat, setNames(rep(0, nrow(mat)), c))
}
# Order
mat <- mat[expected_rows, expected_cols, drop = FALSE]
}) sig not_sig
MIR_peak 12941 11293
not_MIR_peak 67054 64269
sig not_sig
Alu_peak 11335 9596
not_Alu_peak 68660 65966
sig not_sig
L1_peak 6119 5723
not_L1_peak 73876 69839
sig not_sig
L2_peak 10692 9004
not_L2_peak 69303 66558
sig not_sig
ERVK_peak 258 444
not_ERVK_peak 79737 75118
sig not_sig
ERV1_peak 3167 2927
not_ERV1_peak 76828 72635
sig not_sig
ERVL-MaLR_peak 5243 4151
not_ERVL-MaLR_peak 74752 71411
sig not_sig
TcMar_peak 1 2
not_TcMar_peak 79994 75560
sig not_sig
not_hAT_peak 79995 75562# Set names so you can easily refer to each status
names(DNR_3_status_filt_matrices) <- status_columns
odds_ratio_results_filt_DNR_24<- map(DNR_24_status_filt_matrices, function(mat) {
if (!all(dim(mat) == c(2, 2))) return(NULL)
result <- epitools::oddsratio(mat, method = "wald")
or <- result$measure[2, "estimate"]
lower <- result$measure[2, "lower"]
upper <- result$measure[2, "upper"]
pval_chisq <- if("chi.square" %in% colnames(result$p.value) && nrow(result$p.value) >= 2) {
result$p.value[2, "chi.square"]
} else {
NA_real_
}
list(
odds_ratio = or,
lower_ci = lower,
upper_ci = upper,
chi_sq_p = pval_chisq
)
})MTX all
# Vector of status-type column names in your data
status_columns <- c("MIR_status",
                  "Alu_status",
                  "L1_status",
                  "L2_status",
                  "ERVK_status",
                  "ERV1_status",
                  "ERVL-MaLR_status",
                  "TcMar_status",
                  "hAT_status")

# Create a list of matrices, named by status type
MTX_3_status_filt_matrices <- map(status_columns, function(status_col) {
  # Extract prefix (e.g., "TE", "SINE") from column name like "TE_status"
  prefix <- sub("_status$", "", status_col)
  expected_rows <- c(paste0(prefix, "_peak"), paste0("not_", prefix, "_peak"))
  expected_cols <- c("sig", "not_sig")

  # Build matrix
  mat <- all_filt %>%
    group_by(across(all_of(status_col)), MTX_sig_3) %>%
    tally() %>%
    pivot_wider(
      names_from = MTX_sig_3,
      values_from = n,
      values_fill = list(n = 0)
    ) %>%
    column_to_rownames(var = status_col) %>%
    as.matrix()
   print(mat)

  # Fill missing expected rows
  for (r in setdiff(expected_rows, rownames(mat))) {
    mat <- rbind(mat, setNames(rep(0, length(expected_cols)), expected_cols))
    rownames(mat)[nrow(mat)] <- r
  }

  # Fill missing expected columns
  for (c in setdiff(expected_cols, colnames(mat))) {
    mat <- cbind(mat, setNames(rep(0, nrow(mat)), c))
  }

  # Order
  mat <- mat[expected_rows, expected_cols, drop = FALSE]
})
sig not_sig
MIR_peak 139 24095
not_MIR_peak 665 130658
sig not_sig
Alu_peak 95 20836
not_Alu_peak 709 133917
sig not_sig
L1_peak 44 11798
not_L1_peak 760 142955
sig not_sig
L2_peak 120 19576
not_L2_peak 684 135177
sig not_sig
ERVK_peak 2 700
not_ERVK_peak 802 154053
sig not_sig
ERV1_peak 33 6061
not_ERV1_peak 771 148692
sig not_sig
ERVL-MaLR_peak 47 9347
not_ERVL-MaLR_peak 757 145406
not_sig sig
TcMar_peak 3 0
not_TcMar_peak 154750 804
sig not_sig
not_hAT_peak 804 154753# Set names so you can easily refer to each status
names(MTX_3_status_filt_matrices) <- status_columns
odds_ratio_results_filt_MTX_3<- map(MTX_3_status_filt_matrices, function(mat) {
if (!all(dim(mat) == c(2, 2))) return(NULL)
result <- epitools::oddsratio(mat, method = "wald")
or <- result$measure[2, "estimate"]
lower <- result$measure[2, "lower"]
upper <- result$measure[2, "upper"]
pval_chisq <- if("chi.square" %in% colnames(result$p.value) && nrow(result$p.value) >= 2) {
result$p.value[2, "chi.square"]
} else {
NA_real_
}
list(
odds_ratio = or,
lower_ci = lower,
upper_ci = upper,
chi_sq_p = pval_chisq
)
})# Vector of status-type column names in your data
status_columns <- c("MIR_status",
"Alu_status",
"L1_status",
"L2_status",
"ERVK_status",
"ERV1_status",
"ERVL-MaLR_status",
"TcMar_status",
"hAT_status")
# Create a list of matrices, named by status type
MTX_24_status_filt_matrices <- map(status_columns, function(status_col) {
# Extract prefix (e.g., "TE", "SINE") from column name like "TE_status"
prefix <- sub("_status$", "", status_col)
expected_rows <- c(paste0(prefix, "_peak"), paste0("not_", prefix, "_peak"))
expected_cols <- c("sig", "not_sig")
# Build matrix
mat <- all_filt %>%
group_by(across(all_of(status_col)), MTX_sig_24) %>%
tally() %>%
pivot_wider(
names_from = MTX_sig_24,
values_from = n,
values_fill = list(n = 0)
) %>%
column_to_rownames(var = status_col) %>%
as.matrix()
print(mat)
# Fill missing expected rows
for (r in setdiff(expected_rows, rownames(mat))) {
mat <- rbind(mat, setNames(rep(0, length(expected_cols)), expected_cols))
rownames(mat)[nrow(mat)] <- r
}
# Fill missing expected columns
for (c in setdiff(expected_cols, colnames(mat))) {
mat <- cbind(mat, setNames(rep(0, nrow(mat)), c))
}
# Order
mat <- mat[expected_rows, expected_cols, drop = FALSE]
}) sig not_sig
MIR_peak 4129 20105
not_MIR_peak 20121 111202
sig not_sig
Alu_peak 3402 17529
not_Alu_peak 20848 113778
sig not_sig
L1_peak 1694 10148
not_L1_peak 22556 121159
sig not_sig
L2_peak 3425 16271
not_L2_peak 20825 115036
sig not_sig
ERVK_peak 71 631
not_ERVK_peak 24179 130676
sig not_sig
ERV1_peak 882 5212
not_ERV1_peak 23368 126095
sig not_sig
ERVL-MaLR_peak 1608 7786
not_ERVL-MaLR_peak 22642 123521
sig not_sig
TcMar_peak 1 2
not_TcMar_peak 24249 131305
sig not_sig
not_hAT_peak 24250 131307# Set names so you can easily refer to each status
names(MTX_3_status_filt_matrices) <- status_columns
odds_ratio_results_filt_MTX_24<- map(MTX_24_status_filt_matrices, function(mat) {
if (!all(dim(mat) == c(2, 2))) return(NULL)
result <- epitools::oddsratio(mat, method = "wald")
or <- result$measure[2, "estimate"]
lower <- result$measure[2, "lower"]
upper <- result$measure[2, "upper"]
pval_chisq <- if("chi.square" %in% colnames(result$p.value) && nrow(result$p.value) >= 2) {
result$p.value[2, "chi.square"]
} else {
NA_real_
}
list(
odds_ratio = or,
lower_ci = lower,
upper_ci = upper,
chi_sq_p = pval_chisq
)
})Combining the data and applying BH pvalue adjustments
names(odds_ratio_results_filt_DOX_24) <- names(odds_ratio_results_filt_DOX_3)
names(odds_ratio_results_filt_EPI_24) <- names(odds_ratio_results_filt_EPI_3)
names(odds_ratio_results_filt_DNR_24) <- names(odds_ratio_results_filt_DNR_3)
names(odds_ratio_results_filt_MTX_24) <- names(odds_ratio_results_filt_MTX_3)

all_statuses <- unique(unlist(lapply(
  list(
    odds_ratio_results_filt_DOX_3, odds_ratio_results_filt_DOX_24,
    odds_ratio_results_filt_EPI_3, odds_ratio_results_filt_EPI_24,
    odds_ratio_results_filt_DNR_3, odds_ratio_results_filt_DNR_24,
    odds_ratio_results_filt_MTX_3, odds_ratio_results_filt_MTX_24
  ), names
)))

all_sources <- c("DOX_3hr", "DOX_24hr", "EPI_3hr", "EPI_24hr",
                 "DNR_3hr", "DNR_24hr", "MTX_3hr", "MTX_24hr")

# Now build the full long data frame
all_results_long <- bind_rows(
  map_dfr(odds_ratio_results_filt_DOX_3, ~as.data.frame(.x), .id = "status") %>% mutate(source = "DOX_3hr"),
  map_dfr(odds_ratio_results_filt_DOX_24, ~as.data.frame(.x), .id = "status") %>% mutate(source = "DOX_24hr"),
  map_dfr(odds_ratio_results_filt_EPI_3, ~as.data.frame(.x), .id = "status") %>% mutate(source = "EPI_3hr"),
  map_dfr(odds_ratio_results_filt_EPI_24, ~as.data.frame(.x), .id = "status") %>% mutate(source = "EPI_24hr"),
  map_dfr(odds_ratio_results_filt_DNR_3, ~as.data.frame(.x), .id = "status") %>% mutate(source = "DNR_3hr"),
  map_dfr(odds_ratio_results_filt_DNR_24, ~as.data.frame(.x), .id = "status") %>% mutate(source = "DNR_24hr"),
  map_dfr(odds_ratio_results_filt_MTX_3, ~as.data.frame(.x), .id = "status") %>% mutate(source = "MTX_3hr"),
  map_dfr(odds_ratio_results_filt_MTX_24, ~as.data.frame(.x), .id = "status") %>% mutate(source = "MTX_24hr")
)

# Force inclusion of all status × source combinations
combined_df_filt <- expand_grid(status = all_statuses, source = all_sources) %>%
  left_join(all_results_long, by = c("status", "source"))
# saveRDS(combined_df,"data/Final_four_data/re_analysis/OR_results_TE_df_1bp_alltrt.RDS")
my_column_order <- c("DOX_3hr", "EPI_3hr","DNR_3hr","MTX_3hr", "DOX_24hr", "EPI_24hr", "DNR_24hr","MTX_24hr")
### Correct pvalues
TE_sig_mat_filt <- combined_df_filt %>%
dplyr::select( status,source,chi_sq_p) %>%
group_by(source) %>%
mutate(rank_val=rank(chi_sq_p, ties.method = "first")) %>%
mutate(BH_correction= p.adjust(chi_sq_p,method= "BH")) %>%
pivot_wider(., id_cols = status, names_from = source, values_from = BH_correction) %>%
column_to_rownames("status") %>%
as.matrix()
col_fun_OR = colorRamp2(c(0,1,1.5,5), c("blueviolet","white","lightgreen","green3" ))
OR_mat <- combined_df_filt %>%
dplyr::select(status, source, odds_ratio) %>%
group_by(source) %>%
pivot_wider(id_cols = status, names_from = source, values_from = odds_ratio) %>%
column_to_rownames("status") %>%
as.matrix()
# Reorder columns
OR_mat <- OR_mat[, my_column_order]
# Match the significance matrix accordingly
sig_mat <- TE_sig_mat_filt[, my_column_order]
ComplexHeatmap::Heatmap(
OR_mat,
col = col_fun_OR,
cluster_rows = FALSE,
cluster_columns = FALSE,
column_names_side = "top",
column_names_rot = 45,
cell_fun = function(j, i, x, y, width, height, fill) {
if (!is.na(sig_mat[i, j]) && sig_mat[i, j] < 0.05 && OR_mat[i, j] > 1) {
grid.text("*", x, y, gp = gpar(fontsize = 20))
}
}
)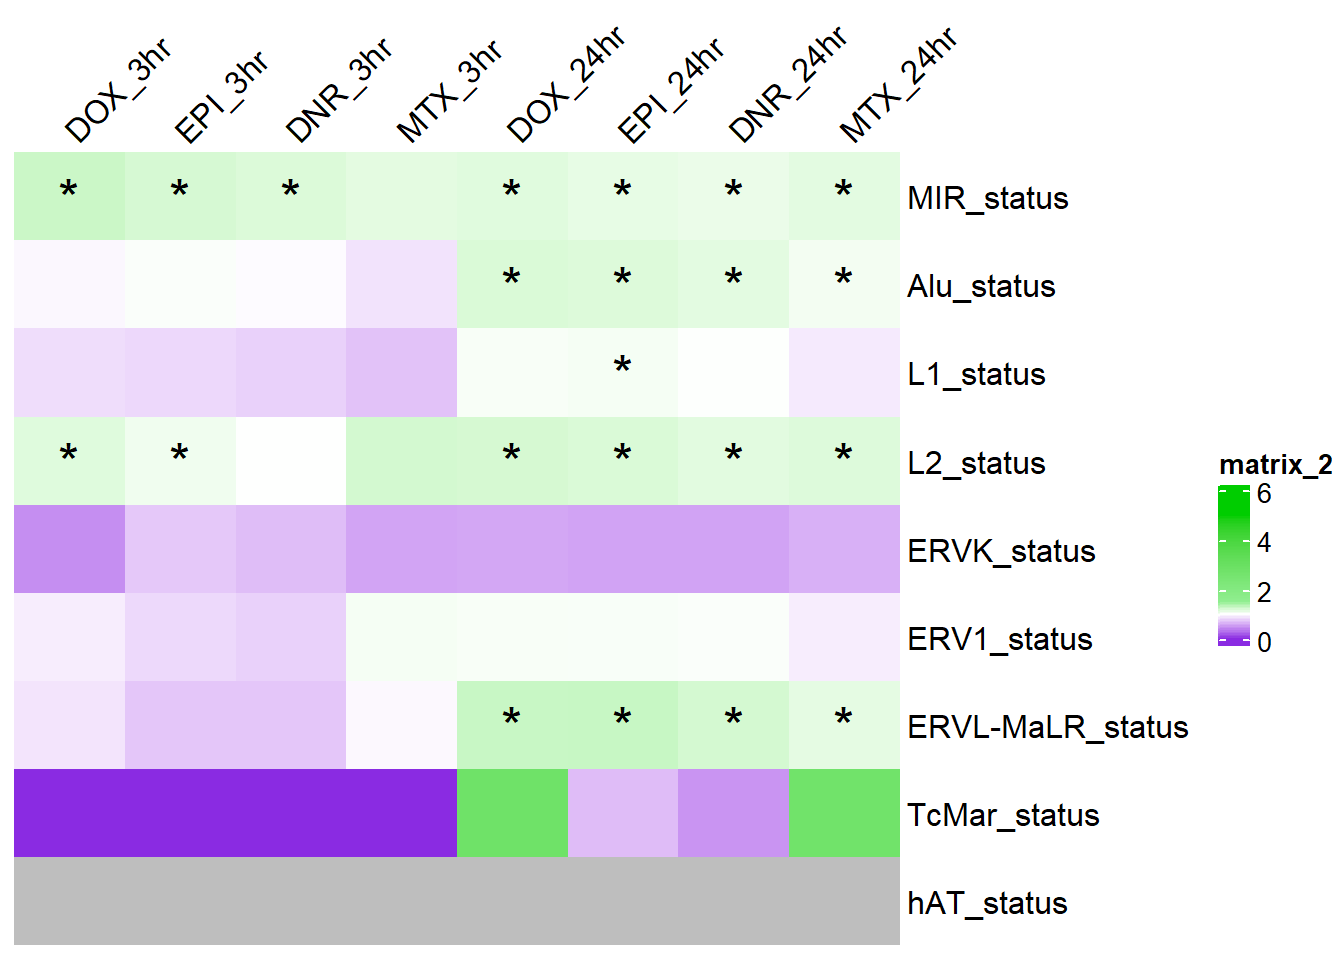
sessionInfo()R version 4.4.2 (2024-10-31 ucrt)
Platform: x86_64-w64-mingw32/x64
Running under: Windows 11 x64 (build 26100)
Matrix products: default
locale:
[1] LC_COLLATE=English_United States.utf8
[2] LC_CTYPE=English_United States.utf8
[3] LC_MONETARY=English_United States.utf8
[4] LC_NUMERIC=C
[5] LC_TIME=English_United States.utf8
time zone: America/Chicago
tzcode source: internal
attached base packages:
[1] grid stats4 stats graphics grDevices utils datasets
[8] methods base
other attached packages:
[1] circlize_0.4.16
[2] epitools_0.5-10.1
[3] ggrepel_0.9.6
[4] plyranges_1.26.0
[5] ggsignif_0.6.4
[6] genomation_1.38.0
[7] smplot2_0.2.5
[8] eulerr_7.0.2
[9] biomaRt_2.62.1
[10] devtools_2.4.5
[11] usethis_3.1.0
[12] ggpubr_0.6.1
[13] BiocParallel_1.40.2
[14] scales_1.4.0
[15] VennDiagram_1.7.3
[16] futile.logger_1.4.3
[17] gridExtra_2.3
[18] ggfortify_0.4.18
[19] edgeR_4.4.2
[20] limma_3.62.2
[21] rtracklayer_1.66.0
[22] org.Hs.eg.db_3.20.0
[23] TxDb.Hsapiens.UCSC.hg38.knownGene_3.20.0
[24] GenomicFeatures_1.58.0
[25] AnnotationDbi_1.68.0
[26] Biobase_2.66.0
[27] GenomicRanges_1.58.0
[28] GenomeInfoDb_1.42.3
[29] IRanges_2.40.1
[30] S4Vectors_0.44.0
[31] BiocGenerics_0.52.0
[32] ChIPseeker_1.42.1
[33] RColorBrewer_1.1-3
[34] broom_1.0.8
[35] kableExtra_1.4.0
[36] lubridate_1.9.4
[37] forcats_1.0.0
[38] stringr_1.5.1
[39] dplyr_1.1.4
[40] purrr_1.0.4
[41] readr_2.1.5
[42] tidyr_1.3.1
[43] tibble_3.3.0
[44] ggplot2_3.5.2
[45] tidyverse_2.0.0
[46] workflowr_1.7.1
loaded via a namespace (and not attached):
[1] fs_1.6.6
[2] matrixStats_1.5.0
[3] bitops_1.0-9
[4] enrichplot_1.26.6
[5] doParallel_1.0.17
[6] httr_1.4.7
[7] profvis_0.4.0
[8] tools_4.4.2
[9] backports_1.5.0
[10] DT_0.33
[11] utf8_1.2.6
[12] R6_2.6.1
[13] lazyeval_0.2.2
[14] GetoptLong_1.0.5
[15] urlchecker_1.0.1
[16] withr_3.0.2
[17] prettyunits_1.2.0
[18] cli_3.6.5
[19] textshaping_1.0.1
[20] formatR_1.14
[21] Cairo_1.6-2
[22] labeling_0.4.3
[23] sass_0.4.10
[24] Rsamtools_2.22.0
[25] systemfonts_1.2.3
[26] yulab.utils_0.2.0
[27] foreign_0.8-90
[28] DOSE_4.0.1
[29] svglite_2.2.1
[30] R.utils_2.13.0
[31] dichromat_2.0-0.1
[32] sessioninfo_1.2.3
[33] plotrix_3.8-4
[34] BSgenome_1.74.0
[35] pwr_1.3-0
[36] impute_1.80.0
[37] rstudioapi_0.17.1
[38] RSQLite_2.4.1
[39] shape_1.4.6.1
[40] generics_0.1.4
[41] gridGraphics_0.5-1
[42] TxDb.Hsapiens.UCSC.hg19.knownGene_3.2.2
[43] BiocIO_1.16.0
[44] crosstalk_1.2.1
[45] vroom_1.6.5
[46] gtools_3.9.5
[47] car_3.1-3
[48] GO.db_3.20.0
[49] Matrix_1.7-3
[50] abind_1.4-8
[51] R.methodsS3_1.8.2
[52] lifecycle_1.0.4
[53] whisker_0.4.1
[54] yaml_2.3.10
[55] carData_3.0-5
[56] SummarizedExperiment_1.36.0
[57] gplots_3.2.0
[58] qvalue_2.38.0
[59] SparseArray_1.6.2
[60] BiocFileCache_2.14.0
[61] blob_1.2.4
[62] promises_1.3.3
[63] crayon_1.5.3
[64] miniUI_0.1.2
[65] ggtangle_0.0.7
[66] lattice_0.22-7
[67] cowplot_1.1.3
[68] KEGGREST_1.46.0
[69] magick_2.8.7
[70] ComplexHeatmap_2.22.0
[71] pillar_1.11.0
[72] knitr_1.50
[73] fgsea_1.32.4
[74] rjson_0.2.23
[75] boot_1.3-31
[76] codetools_0.2-20
[77] fastmatch_1.1-6
[78] glue_1.8.0
[79] getPass_0.2-4
[80] ggfun_0.1.9
[81] data.table_1.17.6
[82] remotes_2.5.0
[83] vctrs_0.6.5
[84] png_0.1-8
[85] treeio_1.30.0
[86] gtable_0.3.6
[87] cachem_1.1.0
[88] xfun_0.52
[89] S4Arrays_1.6.0
[90] mime_0.13
[91] iterators_1.0.14
[92] statmod_1.5.0
[93] ellipsis_0.3.2
[94] nlme_3.1-168
[95] ggtree_3.14.0
[96] bit64_4.6.0-1
[97] filelock_1.0.3
[98] progress_1.2.3
[99] rprojroot_2.0.4
[100] bslib_0.9.0
[101] rpart_4.1.24
[102] KernSmooth_2.23-26
[103] Hmisc_5.2-3
[104] colorspace_2.1-1
[105] DBI_1.2.3
[106] seqPattern_1.38.0
[107] nnet_7.3-20
[108] tidyselect_1.2.1
[109] processx_3.8.6
[110] bit_4.6.0
[111] compiler_4.4.2
[112] curl_6.4.0
[113] git2r_0.36.2
[114] httr2_1.1.2
[115] htmlTable_2.4.3
[116] xml2_1.3.8
[117] DelayedArray_0.32.0
[118] checkmate_2.3.2
[119] caTools_1.18.3
[120] callr_3.7.6
[121] rappdirs_0.3.3
[122] digest_0.6.37
[123] rmarkdown_2.29
[124] XVector_0.46.0
[125] base64enc_0.1-3
[126] htmltools_0.5.8.1
[127] pkgconfig_2.0.3
[128] MatrixGenerics_1.18.1
[129] dbplyr_2.5.0
[130] fastmap_1.2.0
[131] GlobalOptions_0.1.2
[132] rlang_1.1.6
[133] htmlwidgets_1.6.4
[134] UCSC.utils_1.2.0
[135] shiny_1.11.1
[136] farver_2.1.2
[137] jquerylib_0.1.4
[138] zoo_1.8-14
[139] jsonlite_2.0.0
[140] GOSemSim_2.32.0
[141] R.oo_1.27.1
[142] RCurl_1.98-1.17
[143] magrittr_2.0.3
[144] Formula_1.2-5
[145] GenomeInfoDbData_1.2.13
[146] ggplotify_0.1.2
[147] patchwork_1.3.1
[148] Rcpp_1.1.0
[149] ape_5.8-1
[150] stringi_1.8.7
[151] zlibbioc_1.52.0
[152] plyr_1.8.9
[153] pkgbuild_1.4.8
[154] parallel_4.4.2
[155] Biostrings_2.74.1
[156] splines_4.4.2
[157] hms_1.1.3
[158] locfit_1.5-9.12
[159] ps_1.9.1
[160] igraph_2.1.4
[161] reshape2_1.4.4
[162] pkgload_1.4.0
[163] futile.options_1.0.1
[164] XML_3.99-0.18
[165] evaluate_1.0.4
[166] lambda.r_1.2.4
[167] foreach_1.5.2
[168] tzdb_0.5.0
[169] httpuv_1.6.16
[170] clue_0.3-66
[171] gridBase_0.4-7
[172] xtable_1.8-4
[173] restfulr_0.0.16
[174] tidytree_0.4.6
[175] rstatix_0.7.2
[176] later_1.4.2
[177] viridisLite_0.4.2
[178] aplot_0.2.8
[179] memoise_2.0.1
[180] GenomicAlignments_1.42.0
[181] cluster_2.1.8.1
[182] timechange_0.3.0