TE_analysis_DOX_DAR
Renee Matthews
2025-06-05
Last updated: 2025-06-09
Checks: 7 0
Knit directory: ATAC_learning/
This reproducible R Markdown analysis was created with workflowr (version 1.7.1). The Checks tab describes the reproducibility checks that were applied when the results were created. The Past versions tab lists the development history.
Great! Since the R Markdown file has been committed to the Git repository, you know the exact version of the code that produced these results.
Great job! The global environment was empty. Objects defined in the global environment can affect the analysis in your R Markdown file in unknown ways. For reproduciblity it’s best to always run the code in an empty environment.
The command set.seed(20231016) was run prior to running
the code in the R Markdown file. Setting a seed ensures that any results
that rely on randomness, e.g. subsampling or permutations, are
reproducible.
Great job! Recording the operating system, R version, and package versions is critical for reproducibility.
Nice! There were no cached chunks for this analysis, so you can be confident that you successfully produced the results during this run.
Great job! Using relative paths to the files within your workflowr project makes it easier to run your code on other machines.
Great! You are using Git for version control. Tracking code development and connecting the code version to the results is critical for reproducibility.
The results in this page were generated with repository version 7a30fff. See the Past versions tab to see a history of the changes made to the R Markdown and HTML files.
Note that you need to be careful to ensure that all relevant files for
the analysis have been committed to Git prior to generating the results
(you can use wflow_publish or
wflow_git_commit). workflowr only checks the R Markdown
file, but you know if there are other scripts or data files that it
depends on. Below is the status of the Git repository when the results
were generated:
Ignored files:
    Ignored:    .RData
    Ignored:    .Rhistory
    Ignored:    .Rproj.user/
    Ignored:    analysis/H3K27ac_integration_noM.Rmd
    Ignored:    data/ACresp_SNP_table.csv
    Ignored:    data/ARR_SNP_table.csv
    Ignored:    data/All_merged_peaks.tsv
    Ignored:    data/CAD_gwas_dataframe.RDS
    Ignored:    data/CTX_SNP_table.csv
    Ignored:    data/Collapsed_expressed_NG_peak_table.csv
    Ignored:    data/DEG_toplist_sep_n45.RDS
    Ignored:    data/FRiP_first_run.txt
    Ignored:    data/Final_four_data/
    Ignored:    data/Frip_1_reads.csv
    Ignored:    data/Frip_2_reads.csv
    Ignored:    data/Frip_3_reads.csv
    Ignored:    data/Frip_4_reads.csv
    Ignored:    data/Frip_5_reads.csv
    Ignored:    data/Frip_6_reads.csv
    Ignored:    data/GO_KEGG_analysis/
    Ignored:    data/HF_SNP_table.csv
    Ignored:    data/Ind1_75DA24h_dedup_peaks.csv
    Ignored:    data/Ind1_TSS_peaks.RDS
    Ignored:    data/Ind1_firstfragment_files.txt
    Ignored:    data/Ind1_fragment_files.txt
    Ignored:    data/Ind1_peaks_list.RDS
    Ignored:    data/Ind1_summary.txt
    Ignored:    data/Ind2_TSS_peaks.RDS
    Ignored:    data/Ind2_fragment_files.txt
    Ignored:    data/Ind2_peaks_list.RDS
    Ignored:    data/Ind2_summary.txt
    Ignored:    data/Ind3_TSS_peaks.RDS
    Ignored:    data/Ind3_fragment_files.txt
    Ignored:    data/Ind3_peaks_list.RDS
    Ignored:    data/Ind3_summary.txt
    Ignored:    data/Ind4_79B24h_dedup_peaks.csv
    Ignored:    data/Ind4_TSS_peaks.RDS
    Ignored:    data/Ind4_V24h_fraglength.txt
    Ignored:    data/Ind4_fragment_files.txt
    Ignored:    data/Ind4_fragment_filesN.txt
    Ignored:    data/Ind4_peaks_list.RDS
    Ignored:    data/Ind4_summary.txt
    Ignored:    data/Ind5_TSS_peaks.RDS
    Ignored:    data/Ind5_fragment_files.txt
    Ignored:    data/Ind5_fragment_filesN.txt
    Ignored:    data/Ind5_peaks_list.RDS
    Ignored:    data/Ind5_summary.txt
    Ignored:    data/Ind6_TSS_peaks.RDS
    Ignored:    data/Ind6_fragment_files.txt
    Ignored:    data/Ind6_peaks_list.RDS
    Ignored:    data/Ind6_summary.txt
    Ignored:    data/Knowles_4.RDS
    Ignored:    data/Knowles_5.RDS
    Ignored:    data/Knowles_6.RDS
    Ignored:    data/LiSiLTDNRe_TE_df.RDS
    Ignored:    data/MI_gwas.RDS
    Ignored:    data/SNP_GWAS_PEAK_MRC_id
    Ignored:    data/SNP_GWAS_PEAK_MRC_id.csv
    Ignored:    data/SNP_gene_cat_list.tsv
    Ignored:    data/SNP_supp_schneider.RDS
    Ignored:    data/TE_info/
    Ignored:    data/TFmapnames.RDS
    Ignored:    data/all_TSSE_scores.RDS
    Ignored:    data/all_four_filtered_counts.txt
    Ignored:    data/aln_run1_results.txt
    Ignored:    data/anno_ind1_DA24h.RDS
    Ignored:    data/anno_ind4_V24h.RDS
    Ignored:    data/annotated_gwas_SNPS.csv
    Ignored:    data/background_n45_he_peaks.RDS
    Ignored:    data/cardiac_muscle_FRIP.csv
    Ignored:    data/cardiomyocyte_FRIP.csv
    Ignored:    data/col_ng_peak.csv
    Ignored:    data/cormotif_full_4_run.RDS
    Ignored:    data/cormotif_full_4_run_he.RDS
    Ignored:    data/cormotif_full_6_run.RDS
    Ignored:    data/cormotif_full_6_run_he.RDS
    Ignored:    data/cormotif_probability_45_list.csv
    Ignored:    data/cormotif_probability_45_list_he.csv
    Ignored:    data/cormotif_probability_all_6_list.csv
    Ignored:    data/cormotif_probability_all_6_list_he.csv
    Ignored:    data/datasave.RDS
    Ignored:    data/embryo_heart_FRIP.csv
    Ignored:    data/enhancer_list_ENCFF126UHK.bed
    Ignored:    data/enhancerdata/
    Ignored:    data/filt_Peaks_efit2.RDS
    Ignored:    data/filt_Peaks_efit2_bl.RDS
    Ignored:    data/filt_Peaks_efit2_n45.RDS
    Ignored:    data/first_Peaksummarycounts.csv
    Ignored:    data/first_run_frag_counts.txt
    Ignored:    data/full_bedfiles/
    Ignored:    data/gene_ref.csv
    Ignored:    data/gwas_1_dataframe.RDS
    Ignored:    data/gwas_2_dataframe.RDS
    Ignored:    data/gwas_3_dataframe.RDS
    Ignored:    data/gwas_4_dataframe.RDS
    Ignored:    data/gwas_5_dataframe.RDS
    Ignored:    data/high_conf_peak_counts.csv
    Ignored:    data/high_conf_peak_counts.txt
    Ignored:    data/high_conf_peaks_bl_counts.txt
    Ignored:    data/high_conf_peaks_counts.txt
    Ignored:    data/hits_files/
    Ignored:    data/hyper_files/
    Ignored:    data/hypo_files/
    Ignored:    data/ind1_DA24hpeaks.RDS
    Ignored:    data/ind1_TSSE.RDS
    Ignored:    data/ind2_TSSE.RDS
    Ignored:    data/ind3_TSSE.RDS
    Ignored:    data/ind4_TSSE.RDS
    Ignored:    data/ind4_V24hpeaks.RDS
    Ignored:    data/ind5_TSSE.RDS
    Ignored:    data/ind6_TSSE.RDS
    Ignored:    data/initial_complete_stats_run1.txt
    Ignored:    data/left_ventricle_FRIP.csv
    Ignored:    data/median_24_lfc.RDS
    Ignored:    data/median_3_lfc.RDS
    Ignored:    data/mergedPeads.gff
    Ignored:    data/mergedPeaks.gff
    Ignored:    data/motif_list_full
    Ignored:    data/motif_list_n45
    Ignored:    data/motif_list_n45.RDS
    Ignored:    data/multiqc_fastqc_run1.txt
    Ignored:    data/multiqc_fastqc_run2.txt
    Ignored:    data/multiqc_genestat_run1.txt
    Ignored:    data/multiqc_genestat_run2.txt
    Ignored:    data/my_hc_filt_counts.RDS
    Ignored:    data/my_hc_filt_counts_n45.RDS
    Ignored:    data/n45_bedfiles/
    Ignored:    data/n45_files
    Ignored:    data/other_papers/
    Ignored:    data/peakAnnoList_1.RDS
    Ignored:    data/peakAnnoList_2.RDS
    Ignored:    data/peakAnnoList_24_full.RDS
    Ignored:    data/peakAnnoList_24_n45.RDS
    Ignored:    data/peakAnnoList_3.RDS
    Ignored:    data/peakAnnoList_3_full.RDS
    Ignored:    data/peakAnnoList_3_n45.RDS
    Ignored:    data/peakAnnoList_4.RDS
    Ignored:    data/peakAnnoList_5.RDS
    Ignored:    data/peakAnnoList_6.RDS
    Ignored:    data/peakAnnoList_Eight.RDS
    Ignored:    data/peakAnnoList_full_motif.RDS
    Ignored:    data/peakAnnoList_n45_motif.RDS
    Ignored:    data/siglist_full.RDS
    Ignored:    data/siglist_n45.RDS
    Ignored:    data/summarized_peaks_dataframe.txt
    Ignored:    data/summary_peakIDandReHeat.csv
    Ignored:    data/test.list.RDS
    Ignored:    data/testnames.txt
    Ignored:    data/toplist_6.RDS
    Ignored:    data/toplist_full.RDS
    Ignored:    data/toplist_full_DAR_6.RDS
    Ignored:    data/toplist_n45.RDS
    Ignored:    data/trimmed_seq_length.csv
    Ignored:    data/unclassified_full_set_peaks.RDS
    Ignored:    data/unclassified_n45_set_peaks.RDS
    Ignored:    data/xstreme/

Untracked files:
    Untracked:  RNA_seq_integration.Rmd
    Untracked:  Rplot.pdf
    Untracked:  Sig_meta
    Untracked:  analysis/.gitignore
    Untracked:  analysis/Cormotif_analysis_testing diff.Rmd
    Untracked:  analysis/Diagnosis-tmm.Rmd
    Untracked:  analysis/Expressed_RNA_associations.Rmd
    Untracked:  analysis/LFC_corr.Rmd
    Untracked:  analysis/SVA.Rmd
    Untracked:  analysis/Tan2020.Rmd
    Untracked:  analysis/making_master_peaks_list.Rmd
    Untracked:  analysis/my_hc_filt_counts.csv
    Untracked:  code/Concatenations_for_export.R
    Untracked:  code/IGV_snapshot_code.R
    Untracked:  code/LongDARlist.R
    Untracked:  code/just_for_Fun.R
    Untracked:  my_plot.pdf
    Untracked:  my_plot.png
    Untracked:  output/cormotif_probability_45_list.csv
    Untracked:  output/cormotif_probability_all_6_list.csv
    Untracked:  setup.RData

Unstaged changes:
    Modified:   ATAC_learning.Rproj
    Modified:   analysis/AF_HF_SNPs.Rmd
    Modified:   analysis/Cardiotox_SNPs.Rmd
    Modified:   analysis/Cormotif_analysis.Rmd
    Modified:   analysis/H3K27ac_initial_QC.Rmd
    Modified:   analysis/Jaspar_motif.Rmd
    Modified:   analysis/Jaspar_motif_ff.Rmd
    Modified:   analysis/TE_analysis_norm.Rmd
    Modified:   analysis/final_four_analysis.Rmd
Note that any generated files, e.g. HTML, png, CSS, etc., are not included in this status report because it is ok for generated content to have uncommitted changes.
These are the previous versions of the repository in which changes were
made to the R Markdown (analysis/TE_analysis_DOX_DAR.Rmd)
and HTML (docs/TE_analysis_DOX_DAR.html) files. If you’ve
configured a remote Git repository (see ?wflow_git_remote),
click on the hyperlinks in the table below to view the files as they
were in that past version.
| File | Version | Author | Date | Message |
|---|---|---|---|---|
| Rmd | 7a30fff | reneeisnowhere | 2025-06-09 | updateing enrichment test |
| html | ae76ced | reneeisnowhere | 2025-06-06 | Build site. |
| Rmd | 19627dd | reneeisnowhere | 2025-06-06 | new analysis |
library(tidyverse)
library(kableExtra)
library(broom)
library(RColorBrewer)
library(ChIPseeker)
library("TxDb.Hsapiens.UCSC.hg38.knownGene")
library("org.Hs.eg.db")
library(rtracklayer)
library(edgeR)
library(ggfortify)
library(limma)
library(readr)
library(BiocGenerics)
library(gridExtra)
library(VennDiagram)
library(scales)
library(BiocParallel)
library(ggpubr)
library(devtools)
library(biomaRt)
library(eulerr)
library(smplot2)
library(genomation)
library(ggsignif)
library(plyranges)
library(ggrepel)
library(epitools)
library(circlize)
Loading repeatmasker data:
repeatmasker <- read.delim("data/other_papers/repeatmasker.tsv")Subsetting repeatmasker for analysis by class/family
reClass_list <- repeatmasker %>%
  distinct(repClass)

Line_repeats <- repeatmasker %>%
  dplyr::filter(repClass == "LINE") %>%
 makeGRangesFromDataFrame(., keep.extra.columns = TRUE, seqnames.field = "genoName", start.field = "genoStart", end.field = "genoEnd",starts.in.df.are.0based=TRUE)

Sine_repeats <- repeatmasker %>%
  dplyr::filter(repClass == "SINE") %>%
 makeGRangesFromDataFrame(., keep.extra.columns = TRUE, seqnames.field = "genoName", start.field = "genoStart", end.field = "genoEnd",starts.in.df.are.0based=TRUE)

LTR_repeats <- repeatmasker %>%
  dplyr::filter(repClass == "LTR") %>%
 makeGRangesFromDataFrame(., keep.extra.columns = TRUE, seqnames.field = "genoName", start.field = "genoStart", end.field = "genoEnd",starts.in.df.are.0based=TRUE)

DNA_repeats <- repeatmasker %>%
  dplyr::filter(repClass == "DNA") %>%
 makeGRangesFromDataFrame(., keep.extra.columns = TRUE, seqnames.field = "genoName", start.field = "genoStart", end.field = "genoEnd",starts.in.df.are.0based=TRUE)

retroposon_repeats <- repeatmasker %>%
  dplyr::filter(repClass == "Retroposon") %>%
 makeGRangesFromDataFrame(., keep.extra.columns = TRUE, seqnames.field = "genoName", start.field = "genoStart", end.field = "genoEnd",starts.in.df.are.0based=TRUE)

all_TEs_gr <- repeatmasker %>%
 makeGRangesFromDataFrame(., keep.extra.columns = TRUE, seqnames.field = "genoName", start.field = "genoStart", end.field = "genoEnd",starts.in.df.are.0based=TRUE)
Initial overlaps of TEs vs all regions (155,557)
toptable_results <- readRDS("data/Final_four_data/re_analysis/Toptable_results.RDS")
all_regions <- toptable_results$DOX_24$genes

Collapsed_peaks <- read_delim("data/Final_four_data/collapsed_new_peaks.txt",
                              delim = "\t",
                              escape_double = FALSE,
                              trim_ws = TRUE)

Col_TSS_data_gr <- Collapsed_peaks %>%
  dplyr::filter(chr != "chrY") %>%
  dplyr::filter(Peakid %in% all_regions) %>%
  GRanges()
Overlapping all peaks with TEs
overlap_TE_gr <- join_overlap_intersect(Col_TSS_data_gr,all_TEs_gr)
TE_peaks <- overlap_TE_gr %>%
  as.data.frame() %>%
  distinct(Peakid)

LINE_peaks <- overlap_TE_gr %>%
  as.data.frame() %>%
  dplyr::filter(repClass=="LINE") %>%
  distinct(Peakid)

SINE_peaks <- overlap_TE_gr %>%
  as.data.frame() %>%
  dplyr::filter(repClass=="SINE") %>%
  distinct(Peakid)

LTR_peaks <- overlap_TE_gr %>%
  as.data.frame() %>%
  dplyr::filter(repClass=="LTR") %>%
  distinct(Peakid)

DNA_peaks <- overlap_TE_gr %>%
  as.data.frame() %>%
  dplyr::filter(repClass=="DNA") %>%
  distinct(Peakid)

SVA_peaks <- overlap_TE_gr %>%
  as.data.frame() %>%
  dplyr::filter(repClass=="Retroposon") %>%
  distinct(Peakid)

# join sig data by toptable information

all_results  <- toptable_results %>%
  imap(~ .x %>% tibble::rownames_to_column(var = "rowname") %>%
         mutate(source = .y)) %>%
  bind_rows()

annotated_peaks <- all_results %>%
  dplyr::filter(source=="DOX_3"|source=="DOX_24") %>%
  dplyr::select(source,genes,logFC,adj.P.Val) %>%
  pivot_wider(.,id_cols=genes,names_from = source, values_from = c(logFC, adj.P.Val)) %>%
  mutate(TE_status=if_else(genes %in% TE_peaks$Peakid,"TE_peak","not_TE_peak"),
         LINE_status=if_else(genes %in% LINE_peaks$Peakid,"LINE_peak","not_LINE_peak"),
         SINE_status=if_else(genes %in% SINE_peaks$Peakid,"SINE_peak","not_SINE_peak"),
         LTR_status=if_else(genes %in% LTR_peaks$Peakid,"LTR_peak","not_LTR_peak"),
         DNA_status=if_else(genes %in% DNA_peaks$Peakid,"DNA_peak","not_DNA_peak"),
         SVA_status=if_else(genes %in% SVA_peaks$Peakid,"SVA_peak","not_SVA_peak")) %>%
  mutate(sig_3=if_else(adj.P.Val_DOX_3<0.05,"sig","not_sig"),
         sig_24=if_else(adj.P.Val_DOX_24<0.05,"sig","not_sig")) %>%
  mutate(sig_3=factor(sig_3,levels=c("sig","not_sig")),
         sig_24=factor(sig_24,levels=c("sig","not_sig"))) %>%
   mutate(sig_up_3 = case_when(
  adj.P.Val_DOX_3 < 0.05 & logFC_DOX_3 > 0 ~ "sig_up",
  TRUE ~ "not_sig_up"
)) %>%
 mutate(sig_down_3 = case_when(
  adj.P.Val_DOX_3 < 0.05 & logFC_DOX_3 < 0 ~ "sig_down",
  TRUE ~ "not_sig_down"
)) %>%
  mutate(sig_up_24 = case_when(
  adj.P.Val_DOX_24 < 0.05 & logFC_DOX_24 > 0 ~ "sig_up",
  TRUE ~ "not_sig_up"
)) %>%
 mutate(sig_down_24 = case_when(
  adj.P.Val_DOX_24 < 0.05 & logFC_DOX_24 < 0 ~ "sig_down",
  TRUE ~ "not_sig_down"
)) %>%
  mutate(sig_up_3=factor(sig_up_3,levels=c("sig_up","not_sig_up")),
         sig_down_3=factor(sig_down_3,levels=c("sig_down","not_sig_down")),
         sig_up_24=factor(sig_up_24,levels=c("sig_up","not_sig_up")),
         sig_down_24=factor(sig_down_24,levels=c("sig_down","not_sig_down")))
annotated_peaks
# A tibble: 155,557 × 17
genes logFC_DOX_3 logFC_DOX_24 adj.P.Val_DOX_3 adj.P.Val_DOX_24 TE_status
<chr> <dbl> <dbl> <dbl> <dbl> <chr>
1 chr10.72… -2.28 -2.60 0.0000000156 2.55e-13 not_TE_p…
2 chr19.46… -1.80 -2.84 0.00000105 1.02e-14 TE_peak
3 chr7.552… -2.41 -2.24 0.00000115 3.53e-10 TE_peak
4 chr17.19… -1.54 -1.82 0.00000255 2.42e-11 not_TE_p…
5 chr10.90… -1.84 -1.28 0.00000703 5.49e- 6 TE_peak
6 chr14.76… -1.28 -1.45 0.00000703 4.33e-10 TE_peak
7 chr19.51… -2.07 -3.44 0.00000703 3.89e-13 not_TE_p…
8 chr10.70… -1.84 -3.30 0.00000735 6.99e-14 TE_peak
9 chr1.203… 1.69 0.699 0.00000767 7.54e- 3 TE_peak
10 chr12.67… -1.17 -2.16 0.00000989 1.02e-14 TE_peak
# ℹ 155,547 more rows
# ℹ 11 more variables: LINE_status <chr>, SINE_status <chr>, LTR_status <chr>,
# DNA_status <chr>, SVA_status <chr>, sig_3 <fct>, sig_24 <fct>,
# sig_up_3 <fct>, sig_down_3 <fct>, sig_up_24 <fct>, sig_down_24 <fct>DOX_3_TE_mat <- annotated_peaks %>%
group_by(TE_status,sig_3) %>%
tally() %>%
pivot_wider(., id_cols=TE_status,names_from = sig_3,values_from = n) %>%
column_to_rownames("TE_status") %>%
as.matrix()From the code above,
# Vector of status-type column names in your data
status_columns <- c("TE_status", "SINE_status", "LINE_status", "LTR_status", "DNA_status", "SVA_status")

# Create a list of matrices, named by status type
DOX_3_status_matrices <- map(status_columns, function(status_col) {
  # Extract prefix (e.g., "TE", "SINE") from column name like "TE_status"
  prefix <- sub("_status$", "", status_col)
  expected_rows <- c(paste0(prefix, "_peak"), paste0("not_", prefix, "_peak"))
  expected_cols <- c("sig", "not_sig")

  # Build matrix
  mat <- annotated_peaks %>%
    group_by(across(all_of(status_col)), sig_3) %>%
    tally() %>%
    pivot_wider(
      names_from = sig_3,
      values_from = n,
      values_fill = list(n = 0)
    ) %>%
    column_to_rownames(var = status_col) %>%
    as.matrix()
   print(mat)

  # Fill missing expected rows
  for (r in setdiff(expected_rows, rownames(mat))) {
    mat <- rbind(mat, setNames(rep(0, length(expected_cols)), expected_cols))
    rownames(mat)[nrow(mat)] <- r
  }

  # Fill missing expected columns
  for (c in setdiff(expected_cols, colnames(mat))) {
    mat <- cbind(mat, setNames(rep(0, nrow(mat)), c))
  }

  # Order
  mat <- mat[expected_rows, expected_cols, drop = FALSE]
})
sig not_sig
TE_peak 2316 101833
not_TE_peak 1157 50251
sig not_sig
SINE_peak 1028 41766
not_SINE_peak 2445 110318
sig not_sig
LINE_peak 780 33372
not_LINE_peak 2693 118712
sig not_sig
LTR_peak 407 22282
not_LTR_peak 3066 129802
sig not_sig
DNA_peak 297 14796
not_DNA_peak 3176 137288
sig not_sig
SVA_peak 3 288
not_SVA_peak 3470 151796# Set names so you can easily refer to each status
names(DOX_3_status_matrices) <- status_columns
odds_ratio_results_DOX_3 <- map(DOX_3_status_matrices, function(mat) {
if (!all(dim(mat) == c(2, 2))) return(NULL)
result <- epitools::oddsratio(mat, method = "wald")
or <- result$measure[2, "estimate"]
lower <- result$measure[2, "lower"]
upper <- result$measure[2, "upper"]
pval_chisq <- if("chi.square" %in% colnames(result$p.value) && nrow(result$p.value) >= 2) {
result$p.value[2, "chi.square"]
} else {
NA_real_
}
list(
odds_ratio = or,
lower_ci = lower,
upper_ci = upper,
chi_sq_p = pval_chisq
)
})# Create a list of matrices, named by status type
DOX_24_status_matrices <- map(status_columns, function(status_col) {
# Extract prefix (e.g., "TE", "SINE") from column name like "TE_status"
prefix <- sub("_status$", "", status_col)
expected_rows <- c(paste0(prefix, "_peak"), paste0("not_", prefix, "_peak"))
expected_cols <- c("sig", "not_sig")
# Build matrix
mat <- annotated_peaks %>%
group_by(across(all_of(status_col)), sig_24) %>%
tally() %>%
pivot_wider(
names_from = sig_24,
values_from = n,
values_fill = list(n = 0)
) %>%
column_to_rownames(var = status_col) %>%
as.matrix()
print(mat)
# Fill missing expected rows
for (r in setdiff(expected_rows, rownames(mat))) {
mat <- rbind(mat, setNames(rep(0, length(expected_cols)), expected_cols))
rownames(mat)[nrow(mat)] <- r
}
# Fill missing expected columns
for (c in setdiff(expected_cols, colnames(mat))) {
mat <- cbind(mat, setNames(rep(0, nrow(mat)), c))
}
# Order
mat <- mat[expected_rows, expected_cols, drop = FALSE]
}) sig not_sig
TE_peak 44303 59846
not_TE_peak 20517 30891
sig not_sig
SINE_peak 19128 23666
not_SINE_peak 45692 67071
sig not_sig
LINE_peak 15208 18944
not_LINE_peak 49612 71793
sig not_sig
LTR_peak 9971 12718
not_LTR_peak 54849 78019
sig not_sig
DNA_peak 6778 8315
not_DNA_peak 58042 82422
sig not_sig
SVA_peak 79 212
not_SVA_peak 64741 90525# Set names so you can easily refer to each status
names(DOX_24_status_matrices) <- status_columns
odds_ratio_results_DOX_24 <- map(DOX_24_status_matrices, function(mat) {
if (!all(dim(mat) == c(2, 2))) return(NULL)
result <- epitools::oddsratio(mat, method = "wald")
or <- result$measure[2, "estimate"]
lower <- result$measure[2, "lower"]
upper <- result$measure[2, "upper"]
pval_chisq <- if("chi.square" %in% colnames(result$p.value) && nrow(result$p.value) >= 2) {
result$p.value[2, "chi.square"]
} else {
NA_real_
}
list(
odds_ratio = or,
lower_ci = lower,
upper_ci = upper,
chi_sq_p = pval_chisq
)
})DOX 3 hour matrix
# Create a list of matrices, named by status type
DOX_3_sig_up_status_matrices <- map(status_columns, function(status_col) {
  # Extract prefix (e.g., "TE", "SINE") from column name like "TE_status"
  prefix <- sub("_status$", "", status_col)
  expected_rows <- c(paste0(prefix, "_peak"), paste0("not_", prefix, "_peak"))
  expected_cols <- c("sig_up", "not_sig_up")

  # Build matrix
  mat <- annotated_peaks %>%
    group_by(across(all_of(status_col)), sig_up_3) %>%
    tally() %>%
    pivot_wider(
      names_from = sig_up_3,
      values_from = n,
      values_fill = list(n = 0)
    ) %>%
    column_to_rownames(var = status_col) %>%
    as.matrix()
   print(mat)

  # Fill missing expected rows
  for (r in setdiff(expected_rows, rownames(mat))) {
    mat <- rbind(mat, setNames(rep(0, length(expected_cols)), expected_cols))
    rownames(mat)[nrow(mat)] <- r
  }

  # Fill missing expected columns
  for (c in setdiff(expected_cols, colnames(mat))) {
    mat <- cbind(mat, setNames(rep(0, nrow(mat)), c))
  }

  # Order
  mat <- mat[expected_rows, expected_cols, drop = FALSE]
})
sig_up not_sig_up
TE_peak 896 103253
not_TE_peak 333 51075
sig_up not_sig_up
SINE_peak 379 42415
not_SINE_peak 850 111913
sig_up not_sig_up
LINE_peak 317 33835
not_LINE_peak 912 120493
sig_up not_sig_up
LTR_peak 199 22490
not_LTR_peak 1030 131838
sig_up not_sig_up
DNA_peak 123 14970
not_DNA_peak 1106 139358
sig_up not_sig_up
SVA_peak 2 289
not_SVA_peak 1227 154039# Set names so you can easily refer to each status
names(DOX_3_sig_up_status_matrices) <- status_columns
odds_ratio_results_DOX_3_sig_up <- map(DOX_3_sig_up_status_matrices, function(mat) {
if (!all(dim(mat) == c(2, 2))) return(NULL)
result <- epitools::oddsratio(mat, method = "wald")
or <- result$measure[2, "estimate"]
lower <- result$measure[2, "lower"]
upper <- result$measure[2, "upper"]
pval_chisq <- if("chi.square" %in% colnames(result$p.value) && nrow(result$p.value) >= 2) {
result$p.value[2, "chi.square"]
} else {
NA_real_
}
list(
odds_ratio = or,
lower_ci = lower,
upper_ci = upper,
chi_sq_p = pval_chisq
)
})# Create a list of matrices, named by status type
DOX_3_sig_down_status_matrices <- map(status_columns, function(status_col) {
# Extract prefix (e.g., "TE", "SINE") from column name like "TE_status"
prefix <- sub("_status$", "", status_col)
expected_rows <- c(paste0(prefix, "_peak"), paste0("not_", prefix, "_peak"))
expected_cols <- c("sig_down", "not_sig_down")
# Build matrix
mat <- annotated_peaks %>%
group_by(across(all_of(status_col)), sig_down_3) %>%
tally() %>%
pivot_wider(
names_from = sig_down_3,
values_from = n,
values_fill = list(n = 0)
) %>%
column_to_rownames(var = status_col) %>%
as.matrix()
print(mat)
# Fill missing expected rows
for (r in setdiff(expected_rows, rownames(mat))) {
mat <- rbind(mat, setNames(rep(0, length(expected_cols)), expected_cols))
rownames(mat)[nrow(mat)] <- r
}
# Fill missing expected columns
for (c in setdiff(expected_cols, colnames(mat))) {
mat <- cbind(mat, setNames(rep(0, nrow(mat)), c))
}
# Order
mat <- mat[expected_rows, expected_cols, drop = FALSE]
}) sig_down not_sig_down
TE_peak 1420 102729
not_TE_peak 824 50584
sig_down not_sig_down
SINE_peak 649 42145
not_SINE_peak 1595 111168
sig_down not_sig_down
LINE_peak 463 33689
not_LINE_peak 1781 119624
sig_down not_sig_down
LTR_peak 208 22481
not_LTR_peak 2036 130832
sig_down not_sig_down
DNA_peak 174 14919
not_DNA_peak 2070 138394
sig_down not_sig_down
SVA_peak 1 290
not_SVA_peak 2243 153023# Set names so you can easily refer to each status
names(DOX_3_sig_down_status_matrices) <- status_columns
odds_ratio_results_DOX_3_sig_down <- map(DOX_3_sig_down_status_matrices, function(mat) {
if (!all(dim(mat) == c(2, 2))) return(NULL)
result <- epitools::oddsratio(mat, method = "wald")
or <- result$measure[2, "estimate"]
lower <- result$measure[2, "lower"]
upper <- result$measure[2, "upper"]
pval_chisq <- if("chi.square" %in% colnames(result$p.value) && nrow(result$p.value) >= 2) {
result$p.value[2, "chi.square"]
} else {
NA_real_
}
list(
odds_ratio = or,
lower_ci = lower,
upper_ci = upper,
chi_sq_p = pval_chisq
)
})DOX 24 hour matrix
# Create a list of matrices, named by status type
DOX_24_sig_up_status_matrices <- map(status_columns, function(status_col) {
  # Extract prefix (e.g., "TE", "SINE") from column name like "TE_status"
  prefix <- sub("_status$", "", status_col)
  expected_rows <- c(paste0(prefix, "_peak"), paste0("not_", prefix, "_peak"))
  expected_cols <- c("sig_up", "not_sig_up")

  # Build matrix
  mat <- annotated_peaks %>%
    group_by(across(all_of(status_col)), sig_up_24) %>%
    tally() %>%
    pivot_wider(
      names_from = sig_up_24,
      values_from = n,
      values_fill = list(n = 0)
    ) %>%
    column_to_rownames(var = status_col) %>%
    as.matrix()
   print(mat)

  # Fill missing expected rows
  for (r in setdiff(expected_rows, rownames(mat))) {
    mat <- rbind(mat, setNames(rep(0, length(expected_cols)), expected_cols))
    rownames(mat)[nrow(mat)] <- r
  }

  # Fill missing expected columns
  for (c in setdiff(expected_cols, colnames(mat))) {
    mat <- cbind(mat, setNames(rep(0, nrow(mat)), c))
  }

  # Order
  mat <- mat[expected_rows, expected_cols, drop = FALSE]
})
sig_up not_sig_up
TE_peak 22996 81153
not_TE_peak 9511 41897
sig_up not_sig_up
SINE_peak 10343 32451
not_SINE_peak 22164 90599
sig_up not_sig_up
LINE_peak 8165 25987
not_LINE_peak 24342 97063
sig_up not_sig_up
LTR_peak 5478 17211
not_LTR_peak 27029 105839
sig_up not_sig_up
DNA_peak 3823 11270
not_DNA_peak 28684 111780
sig_up not_sig_up
SVA_peak 41 250
not_SVA_peak 32466 122800# Set names so you can easily refer to each status
names(DOX_24_sig_up_status_matrices) <- status_columns
odds_ratio_results_DOX_24_sig_up <- map(DOX_24_sig_up_status_matrices, function(mat) {
if (!all(dim(mat) == c(2, 2))) return(NULL)
result <- epitools::oddsratio(mat, method = "wald")
or <- result$measure[2, "estimate"]
lower <- result$measure[2, "lower"]
upper <- result$measure[2, "upper"]
pval_chisq <- if("chi.square" %in% colnames(result$p.value) && nrow(result$p.value) >= 2) {
result$p.value[2, "chi.square"]
} else {
NA_real_
}
list(
odds_ratio = or,
lower_ci = lower,
upper_ci = upper,
chi_sq_p = pval_chisq
)
})# Create a list of matrices, named by status type
DOX_24_sig_down_status_matrices <- map(status_columns, function(status_col) {
# Extract prefix (e.g., "TE", "SINE") from column name like "TE_status"
prefix <- sub("_status$", "", status_col)
expected_rows <- c(paste0(prefix, "_peak"), paste0("not_", prefix, "_peak"))
expected_cols <- c("sig_down", "not_sig_down")
# Build matrix
mat <- annotated_peaks %>%
group_by(across(all_of(status_col)), sig_down_24) %>%
tally() %>%
pivot_wider(
names_from = sig_down_24,
values_from = n,
values_fill = list(n = 0)
) %>%
column_to_rownames(var = status_col) %>%
as.matrix()
print(mat)
# Fill missing expected rows
for (r in setdiff(expected_rows, rownames(mat))) {
mat <- rbind(mat, setNames(rep(0, length(expected_cols)), expected_cols))
rownames(mat)[nrow(mat)] <- r
}
# Fill missing expected columns
for (c in setdiff(expected_cols, colnames(mat))) {
mat <- cbind(mat, setNames(rep(0, nrow(mat)), c))
}
# Order
mat <- mat[expected_rows, expected_cols, drop = FALSE]
}) sig_down not_sig_down
TE_peak 21307 82842
not_TE_peak 11006 40402
sig_down not_sig_down
SINE_peak 8785 34009
not_SINE_peak 23528 89235
sig_down not_sig_down
LINE_peak 7043 27109
not_LINE_peak 25270 96135
sig_down not_sig_down
LTR_peak 4493 18196
not_LTR_peak 27820 105048
sig_down not_sig_down
DNA_peak 2955 12138
not_DNA_peak 29358 111106
sig_down not_sig_down
SVA_peak 38 253
not_SVA_peak 32275 122991# Set names so you can easily refer to each status
names(DOX_24_sig_down_status_matrices) <- status_columns
odds_ratio_results_DOX_24_sig_down <- map(DOX_24_sig_down_status_matrices, function(mat) {
if (!all(dim(mat) == c(2, 2))) return(NULL)
result <- epitools::oddsratio(mat, method = "wald")
or <- result$measure[2, "estimate"]
lower <- result$measure[2, "lower"]
upper <- result$measure[2, "upper"]
pval_chisq <- if("chi.square" %in% colnames(result$p.value) && nrow(result$p.value) >= 2) {
result$p.value[2, "chi.square"]
} else {
NA_real_
}
list(
odds_ratio = or,
lower_ci = lower,
upper_ci = upper,
chi_sq_p = pval_chisq
)
})Combining the data and applying BH pvalue adjustments
# odds_ratio_results_DOX_3
# odds_ratio_results_DOX_24
# odds_ratio_results_DOX_24_sig_up
# odds_ratio_results_DOX_24_sig_down

combined_df <- bind_rows(
  map_dfr(odds_ratio_results_DOX_3, ~as.data.frame(.x), .id = "status") %>% mutate(source = "DOX_3hr"),
  map_dfr(odds_ratio_results_DOX_24, ~as.data.frame(.x), .id = "status") %>% mutate(source = "DOX_24hr"),
  map_dfr(odds_ratio_results_DOX_3_sig_up, ~as.data.frame(.x), .id = "status") %>% mutate(source = "DOX_3hr_sigup"),
  map_dfr(odds_ratio_results_DOX_3_sig_down, ~as.data.frame(.x), .id = "status") %>% mutate(source = "DOX_3hr_sigdown"),
  map_dfr(odds_ratio_results_DOX_24_sig_up, ~as.data.frame(.x), .id = "status") %>% mutate(source = "DOX_24hr_sigup"),
  map_dfr(odds_ratio_results_DOX_24_sig_down, ~as.data.frame(.x), .id = "status") %>% mutate(source = "DOX_24hr_sigdown")
)
TE_sig_mat <- combined_df %>%
dplyr::select( status,source,chi_sq_p) %>%
group_by(source) %>%
mutate(rank_val=rank(chi_sq_p, ties.method = "first")) %>%
mutate(BH_correction= p.adjust(chi_sq_p,method= "BH")) %>%
pivot_wider(., id_cols = status, names_from = source, values_from = BH_correction) %>%
column_to_rownames("status") %>%
as.matrix()
col_fun_OR = colorRamp2(c(0,1,1.5,5), c("blueviolet","white","lightgreen","green3" ))
# TE_od_mat <-
combined_df %>%
dplyr::select(status, source, odds_ratio) %>%
group_by(source) %>%
pivot_wider(., id_cols = status, names_from = source, values_from = odds_ratio) %>%
column_to_rownames("status") %>%
as.matrix() %>%
ComplexHeatmap::Heatmap(. ,col = col_fun_OR,
cluster_rows=FALSE,
cluster_columns=FALSE,
column_names_side = "top",
column_names_rot = 45,
# na_col = "black",
cell_fun = function(j, i, x, y, width, height, fill) {if (!is.na(TE_sig_mat[i, j]) && TE_sig_mat[i, j] < 0.05 && .[i, j] > 1) {
grid.text("*", x, y, gp = gpar(fontsize = 20))}})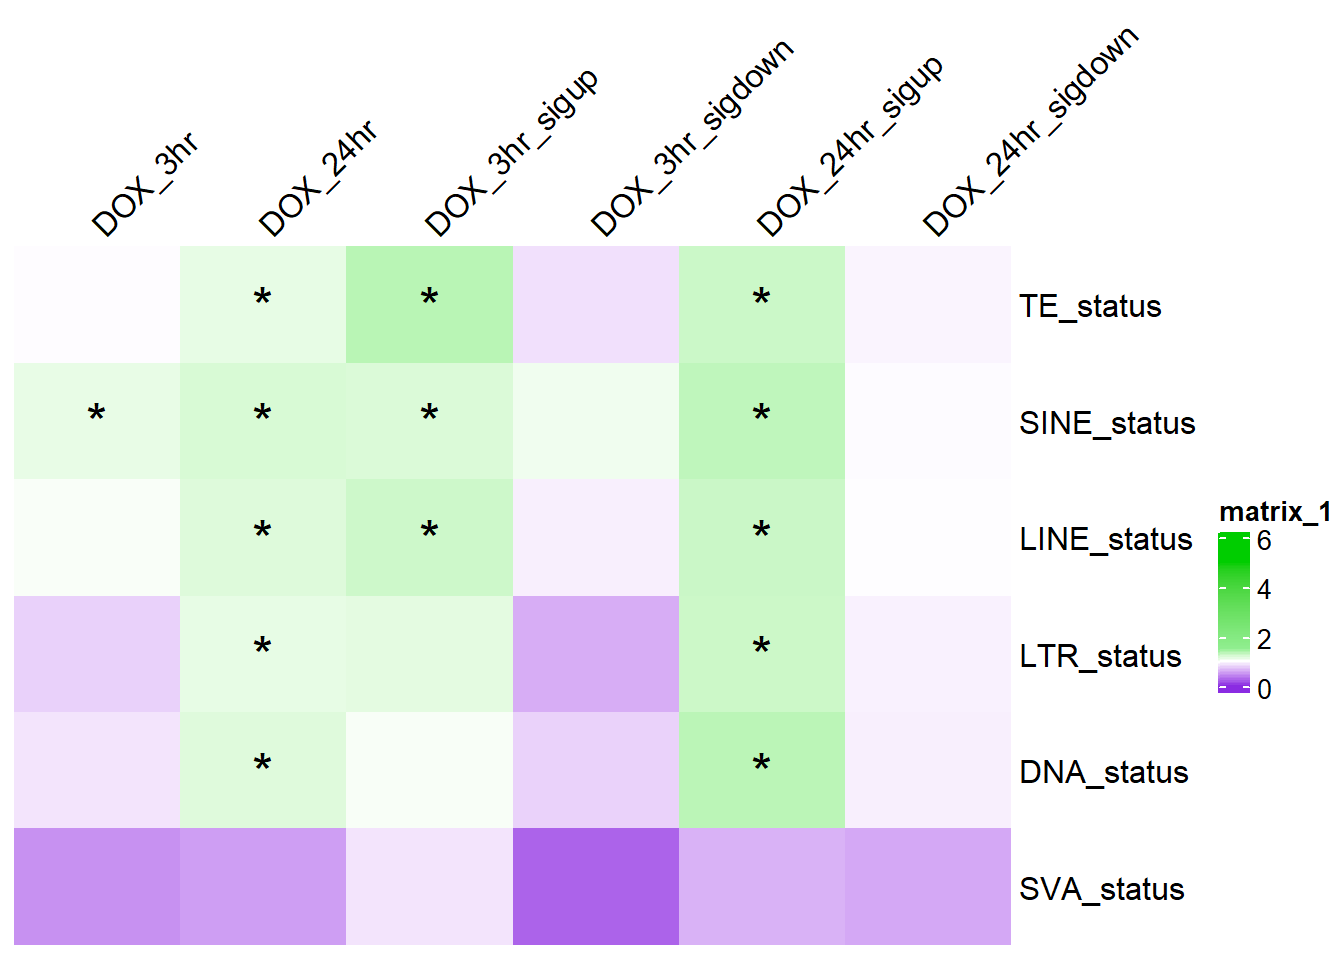
| Version | Author | Date |
|---|---|---|
| ae76ced | reneeisnowhere | 2025-06-06 |
sessionInfo()R version 4.4.2 (2024-10-31 ucrt)
Platform: x86_64-w64-mingw32/x64
Running under: Windows 11 x64 (build 26100)
Matrix products: default
locale:
[1] LC_COLLATE=English_United States.utf8
[2] LC_CTYPE=English_United States.utf8
[3] LC_MONETARY=English_United States.utf8
[4] LC_NUMERIC=C
[5] LC_TIME=English_United States.utf8
time zone: America/Chicago
tzcode source: internal
attached base packages:
[1] grid stats4 stats graphics grDevices utils datasets
[8] methods base
other attached packages:
[1] circlize_0.4.16
[2] epitools_0.5-10.1
[3] ggrepel_0.9.6
[4] plyranges_1.26.0
[5] ggsignif_0.6.4
[6] genomation_1.38.0
[7] smplot2_0.2.5
[8] eulerr_7.0.2
[9] biomaRt_2.62.1
[10] devtools_2.4.5
[11] usethis_3.1.0
[12] ggpubr_0.6.0
[13] BiocParallel_1.40.0
[14] scales_1.3.0
[15] VennDiagram_1.7.3
[16] futile.logger_1.4.3
[17] gridExtra_2.3
[18] ggfortify_0.4.17
[19] edgeR_4.4.2
[20] limma_3.62.2
[21] rtracklayer_1.66.0
[22] org.Hs.eg.db_3.20.0
[23] TxDb.Hsapiens.UCSC.hg38.knownGene_3.20.0
[24] GenomicFeatures_1.58.0
[25] AnnotationDbi_1.68.0
[26] Biobase_2.66.0
[27] GenomicRanges_1.58.0
[28] GenomeInfoDb_1.42.3
[29] IRanges_2.40.1
[30] S4Vectors_0.44.0
[31] BiocGenerics_0.52.0
[32] ChIPseeker_1.42.1
[33] RColorBrewer_1.1-3
[34] broom_1.0.7
[35] kableExtra_1.4.0
[36] lubridate_1.9.4
[37] forcats_1.0.0
[38] stringr_1.5.1
[39] dplyr_1.1.4
[40] purrr_1.0.4
[41] readr_2.1.5
[42] tidyr_1.3.1
[43] tibble_3.2.1
[44] ggplot2_3.5.1
[45] tidyverse_2.0.0
[46] workflowr_1.7.1
loaded via a namespace (and not attached):
[1] fs_1.6.5
[2] matrixStats_1.5.0
[3] bitops_1.0-9
[4] enrichplot_1.26.6
[5] doParallel_1.0.17
[6] httr_1.4.7
[7] profvis_0.4.0
[8] tools_4.4.2
[9] backports_1.5.0
[10] utf8_1.2.4
[11] R6_2.6.1
[12] lazyeval_0.2.2
[13] GetoptLong_1.0.5
[14] urlchecker_1.0.1
[15] withr_3.0.2
[16] prettyunits_1.2.0
[17] cli_3.6.4
[18] formatR_1.14
[19] Cairo_1.6-2
[20] sass_0.4.9
[21] Rsamtools_2.22.0
[22] systemfonts_1.2.1
[23] yulab.utils_0.2.0
[24] foreign_0.8-88
[25] DOSE_4.0.0
[26] svglite_2.1.3
[27] R.utils_2.13.0
[28] sessioninfo_1.2.3
[29] plotrix_3.8-4
[30] BSgenome_1.74.0
[31] pwr_1.3-0
[32] impute_1.80.0
[33] rstudioapi_0.17.1
[34] RSQLite_2.3.9
[35] shape_1.4.6.1
[36] generics_0.1.3
[37] gridGraphics_0.5-1
[38] TxDb.Hsapiens.UCSC.hg19.knownGene_3.2.2
[39] BiocIO_1.16.0
[40] vroom_1.6.5
[41] gtools_3.9.5
[42] car_3.1-3
[43] GO.db_3.20.0
[44] Matrix_1.7-3
[45] abind_1.4-8
[46] R.methodsS3_1.8.2
[47] lifecycle_1.0.4
[48] whisker_0.4.1
[49] yaml_2.3.10
[50] carData_3.0-5
[51] SummarizedExperiment_1.36.0
[52] gplots_3.2.0
[53] qvalue_2.38.0
[54] SparseArray_1.6.2
[55] BiocFileCache_2.14.0
[56] blob_1.2.4
[57] promises_1.3.2
[58] crayon_1.5.3
[59] miniUI_0.1.1.1
[60] ggtangle_0.0.6
[61] lattice_0.22-6
[62] cowplot_1.1.3
[63] KEGGREST_1.46.0
[64] magick_2.8.5
[65] ComplexHeatmap_2.22.0
[66] pillar_1.10.1
[67] knitr_1.49
[68] fgsea_1.32.2
[69] rjson_0.2.23
[70] boot_1.3-31
[71] codetools_0.2-20
[72] fastmatch_1.1-6
[73] glue_1.8.0
[74] getPass_0.2-4
[75] ggfun_0.1.8
[76] data.table_1.17.0
[77] remotes_2.5.0
[78] vctrs_0.6.5
[79] png_0.1-8
[80] treeio_1.30.0
[81] gtable_0.3.6
[82] cachem_1.1.0
[83] xfun_0.51
[84] S4Arrays_1.6.0
[85] mime_0.12
[86] iterators_1.0.14
[87] statmod_1.5.0
[88] ellipsis_0.3.2
[89] nlme_3.1-167
[90] ggtree_3.14.0
[91] bit64_4.6.0-1
[92] filelock_1.0.3
[93] progress_1.2.3
[94] rprojroot_2.0.4
[95] bslib_0.9.0
[96] rpart_4.1.24
[97] KernSmooth_2.23-26
[98] Hmisc_5.2-2
[99] colorspace_2.1-1
[100] DBI_1.2.3
[101] seqPattern_1.38.0
[102] nnet_7.3-20
[103] tidyselect_1.2.1
[104] processx_3.8.6
[105] bit_4.6.0
[106] compiler_4.4.2
[107] curl_6.2.1
[108] git2r_0.35.0
[109] httr2_1.1.1
[110] htmlTable_2.4.3
[111] xml2_1.3.7
[112] DelayedArray_0.32.0
[113] checkmate_2.3.2
[114] caTools_1.18.3
[115] callr_3.7.6
[116] rappdirs_0.3.3
[117] digest_0.6.37
[118] rmarkdown_2.29
[119] XVector_0.46.0
[120] base64enc_0.1-3
[121] htmltools_0.5.8.1
[122] pkgconfig_2.0.3
[123] MatrixGenerics_1.18.1
[124] dbplyr_2.5.0
[125] fastmap_1.2.0
[126] GlobalOptions_0.1.2
[127] rlang_1.1.5
[128] htmlwidgets_1.6.4
[129] UCSC.utils_1.2.0
[130] shiny_1.10.0
[131] farver_2.1.2
[132] jquerylib_0.1.4
[133] zoo_1.8-13
[134] jsonlite_1.9.1
[135] GOSemSim_2.32.0
[136] R.oo_1.27.0
[137] RCurl_1.98-1.16
[138] magrittr_2.0.3
[139] Formula_1.2-5
[140] GenomeInfoDbData_1.2.13
[141] ggplotify_0.1.2
[142] patchwork_1.3.0
[143] munsell_0.5.1
[144] Rcpp_1.0.14
[145] ape_5.8-1
[146] stringi_1.8.4
[147] zlibbioc_1.52.0
[148] plyr_1.8.9
[149] pkgbuild_1.4.6
[150] parallel_4.4.2
[151] Biostrings_2.74.1
[152] splines_4.4.2
[153] hms_1.1.3
[154] locfit_1.5-9.12
[155] ps_1.9.0
[156] igraph_2.1.4
[157] reshape2_1.4.4
[158] pkgload_1.4.0
[159] futile.options_1.0.1
[160] XML_3.99-0.18
[161] evaluate_1.0.3
[162] lambda.r_1.2.4
[163] foreach_1.5.2
[164] tzdb_0.4.0
[165] httpuv_1.6.15
[166] clue_0.3-66
[167] gridBase_0.4-7
[168] xtable_1.8-4
[169] restfulr_0.0.15
[170] tidytree_0.4.6
[171] rstatix_0.7.2
[172] later_1.4.1
[173] viridisLite_0.4.2
[174] aplot_0.2.5
[175] memoise_2.0.1
[176] GenomicAlignments_1.42.0
[177] cluster_2.1.8.1
[178] timechange_0.3.0