Combine_data
ERM
2024-11-14
Last updated: 2024-11-14
Checks: 7 0
Knit directory: ATAC_learning/
This reproducible R Markdown analysis was created with workflowr (version 1.7.1). The Checks tab describes the reproducibility checks that were applied when the results were created. The Past versions tab lists the development history.
Great! Since the R Markdown file has been committed to the Git repository, you know the exact version of the code that produced these results.
Great job! The global environment was empty. Objects defined in the global environment can affect the analysis in your R Markdown file in unknown ways. For reproduciblity it’s best to always run the code in an empty environment.
The command set.seed(20231016) was run prior to running
the code in the R Markdown file. Setting a seed ensures that any results
that rely on randomness, e.g. subsampling or permutations, are
reproducible.
Great job! Recording the operating system, R version, and package versions is critical for reproducibility.
Nice! There were no cached chunks for this analysis, so you can be confident that you successfully produced the results during this run.
Great job! Using relative paths to the files within your workflowr project makes it easier to run your code on other machines.
Great! You are using Git for version control. Tracking code development and connecting the code version to the results is critical for reproducibility.
The results in this page were generated with repository version 0cdaa94. See the Past versions tab to see a history of the changes made to the R Markdown and HTML files.
Note that you need to be careful to ensure that all relevant files for
the analysis have been committed to Git prior to generating the results
(you can use wflow_publish or
wflow_git_commit). workflowr only checks the R Markdown
file, but you know if there are other scripts or data files that it
depends on. Below is the status of the Git repository when the results
were generated:
Ignored files:
    Ignored:    .RData
    Ignored:    .Rhistory
    Ignored:    .Rproj.user/
    Ignored:    data/ACresp_SNP_table.csv
    Ignored:    data/ARR_SNP_table.csv
    Ignored:    data/All_merged_peaks.tsv
    Ignored:    data/CAD_gwas_dataframe.RDS
    Ignored:    data/CTX_SNP_table.csv
    Ignored:    data/Collapsed_expressed_NG_peak_table.csv
    Ignored:    data/DEG_toplist_sep_n45.RDS
    Ignored:    data/FRiP_first_run.txt
    Ignored:    data/Final_four_data/
    Ignored:    data/Frip_1_reads.csv
    Ignored:    data/Frip_2_reads.csv
    Ignored:    data/Frip_3_reads.csv
    Ignored:    data/Frip_4_reads.csv
    Ignored:    data/Frip_5_reads.csv
    Ignored:    data/Frip_6_reads.csv
    Ignored:    data/GO_KEGG_analysis/
    Ignored:    data/HF_SNP_table.csv
    Ignored:    data/Ind1_75DA24h_dedup_peaks.csv
    Ignored:    data/Ind1_TSS_peaks.RDS
    Ignored:    data/Ind1_firstfragment_files.txt
    Ignored:    data/Ind1_fragment_files.txt
    Ignored:    data/Ind1_peaks_list.RDS
    Ignored:    data/Ind1_summary.txt
    Ignored:    data/Ind2_TSS_peaks.RDS
    Ignored:    data/Ind2_fragment_files.txt
    Ignored:    data/Ind2_peaks_list.RDS
    Ignored:    data/Ind2_summary.txt
    Ignored:    data/Ind3_TSS_peaks.RDS
    Ignored:    data/Ind3_fragment_files.txt
    Ignored:    data/Ind3_peaks_list.RDS
    Ignored:    data/Ind3_summary.txt
    Ignored:    data/Ind4_79B24h_dedup_peaks.csv
    Ignored:    data/Ind4_TSS_peaks.RDS
    Ignored:    data/Ind4_V24h_fraglength.txt
    Ignored:    data/Ind4_fragment_files.txt
    Ignored:    data/Ind4_fragment_filesN.txt
    Ignored:    data/Ind4_peaks_list.RDS
    Ignored:    data/Ind4_summary.txt
    Ignored:    data/Ind5_TSS_peaks.RDS
    Ignored:    data/Ind5_fragment_files.txt
    Ignored:    data/Ind5_fragment_filesN.txt
    Ignored:    data/Ind5_peaks_list.RDS
    Ignored:    data/Ind5_summary.txt
    Ignored:    data/Ind6_TSS_peaks.RDS
    Ignored:    data/Ind6_fragment_files.txt
    Ignored:    data/Ind6_peaks_list.RDS
    Ignored:    data/Ind6_summary.txt
    Ignored:    data/Knowles_4.RDS
    Ignored:    data/Knowles_5.RDS
    Ignored:    data/Knowles_6.RDS
    Ignored:    data/LiSiLTDNRe_TE_df.RDS
    Ignored:    data/MI_gwas.RDS
    Ignored:    data/SNP_GWAS_PEAK_MRC_id
    Ignored:    data/SNP_GWAS_PEAK_MRC_id.csv
    Ignored:    data/SNP_gene_cat_list.tsv
    Ignored:    data/SNP_supp_schneider.RDS
    Ignored:    data/TE_info/
    Ignored:    data/TFmapnames.RDS
    Ignored:    data/all_TSSE_scores.RDS
    Ignored:    data/all_four_filtered_counts.txt
    Ignored:    data/aln_run1_results.txt
    Ignored:    data/anno_ind1_DA24h.RDS
    Ignored:    data/anno_ind4_V24h.RDS
    Ignored:    data/annotated_gwas_SNPS.csv
    Ignored:    data/background_n45_he_peaks.RDS
    Ignored:    data/cardiac_muscle_FRIP.csv
    Ignored:    data/cardiomyocyte_FRIP.csv
    Ignored:    data/col_ng_peak.csv
    Ignored:    data/cormotif_full_4_run.RDS
    Ignored:    data/cormotif_full_4_run_he.RDS
    Ignored:    data/cormotif_full_6_run.RDS
    Ignored:    data/cormotif_full_6_run_he.RDS
    Ignored:    data/cormotif_probability_45_list.csv
    Ignored:    data/cormotif_probability_45_list_he.csv
    Ignored:    data/cormotif_probability_all_6_list.csv
    Ignored:    data/cormotif_probability_all_6_list_he.csv
    Ignored:    data/embryo_heart_FRIP.csv
    Ignored:    data/enhancer_list_ENCFF126UHK.bed
    Ignored:    data/enhancerdata/
    Ignored:    data/filt_Peaks_efit2.RDS
    Ignored:    data/filt_Peaks_efit2_bl.RDS
    Ignored:    data/filt_Peaks_efit2_n45.RDS
    Ignored:    data/first_Peaksummarycounts.csv
    Ignored:    data/first_run_frag_counts.txt
    Ignored:    data/full_bedfiles/
    Ignored:    data/gene_ref.csv
    Ignored:    data/gwas_1_dataframe.RDS
    Ignored:    data/gwas_2_dataframe.RDS
    Ignored:    data/gwas_3_dataframe.RDS
    Ignored:    data/gwas_4_dataframe.RDS
    Ignored:    data/gwas_5_dataframe.RDS
    Ignored:    data/high_conf_peak_counts.csv
    Ignored:    data/high_conf_peak_counts.txt
    Ignored:    data/high_conf_peaks_bl_counts.txt
    Ignored:    data/high_conf_peaks_counts.txt
    Ignored:    data/hits_files/
    Ignored:    data/hyper_files/
    Ignored:    data/hypo_files/
    Ignored:    data/ind1_DA24hpeaks.RDS
    Ignored:    data/ind1_TSSE.RDS
    Ignored:    data/ind2_TSSE.RDS
    Ignored:    data/ind3_TSSE.RDS
    Ignored:    data/ind4_TSSE.RDS
    Ignored:    data/ind4_V24hpeaks.RDS
    Ignored:    data/ind5_TSSE.RDS
    Ignored:    data/ind6_TSSE.RDS
    Ignored:    data/initial_complete_stats_run1.txt
    Ignored:    data/left_ventricle_FRIP.csv
    Ignored:    data/median_24_lfc.RDS
    Ignored:    data/median_3_lfc.RDS
    Ignored:    data/mergedPeads.gff
    Ignored:    data/mergedPeaks.gff
    Ignored:    data/motif_list_full
    Ignored:    data/motif_list_n45
    Ignored:    data/motif_list_n45.RDS
    Ignored:    data/multiqc_fastqc_run1.txt
    Ignored:    data/multiqc_fastqc_run2.txt
    Ignored:    data/multiqc_genestat_run1.txt
    Ignored:    data/multiqc_genestat_run2.txt
    Ignored:    data/my_hc_filt_counts.RDS
    Ignored:    data/my_hc_filt_counts_n45.RDS
    Ignored:    data/n45_bedfiles/
    Ignored:    data/n45_files
    Ignored:    data/other_papers/
    Ignored:    data/peakAnnoList_1.RDS
    Ignored:    data/peakAnnoList_2.RDS
    Ignored:    data/peakAnnoList_24_full.RDS
    Ignored:    data/peakAnnoList_24_n45.RDS
    Ignored:    data/peakAnnoList_3.RDS
    Ignored:    data/peakAnnoList_3_full.RDS
    Ignored:    data/peakAnnoList_3_n45.RDS
    Ignored:    data/peakAnnoList_4.RDS
    Ignored:    data/peakAnnoList_5.RDS
    Ignored:    data/peakAnnoList_6.RDS
    Ignored:    data/peakAnnoList_Eight.RDS
    Ignored:    data/peakAnnoList_full_motif.RDS
    Ignored:    data/peakAnnoList_n45_motif.RDS
    Ignored:    data/siglist_full.RDS
    Ignored:    data/siglist_n45.RDS
    Ignored:    data/summary_peakIDandReHeat.csv
    Ignored:    data/test.list.RDS
    Ignored:    data/testnames.txt
    Ignored:    data/toplist_6.RDS
    Ignored:    data/toplist_full.RDS
    Ignored:    data/toplist_full_DAR_6.RDS
    Ignored:    data/toplist_n45.RDS
    Ignored:    data/trimmed_seq_length.csv
    Ignored:    data/unclassified_full_set_peaks.RDS
    Ignored:    data/unclassified_n45_set_peaks.RDS
    Ignored:    data/xstreme/
    Ignored:    trimmed_Ind1_75DA24h_S7.nodup.splited.bam/

Untracked files:
    Untracked:  Correlationplot_scaled.pdf
    Untracked:  DOX_DAR_assess.Rmd
    Untracked:  EAR_2_plot.pdf
    Untracked:  ESR_1_plot.pdf
    Untracked:  Firstcorr plotATAC.pdf
    Untracked:  IND1_2_3_6_corrplot.pdf
    Untracked:  LR_3_plot.pdf
    Untracked:  NR_1_plot.pdf
    Untracked:  analysis/Expressed_RNA_associations.Rmd
    Untracked:  analysis/LFC_corr.Rmd
    Untracked:  analysis/SVA.Rmd
    Untracked:  analysis/my_hc_filt_counts.csv
    Untracked:  analysis/nucleosome_explore.Rmd
    Untracked:  code/IGV_snapshot_code.R
    Untracked:  code/LongDARlist.R
    Untracked:  code/MRC_clusterlog2cpm.R
    Untracked:  code/TSSE.R
    Untracked:  code/just_for_Fun.R
    Untracked:  code/toplist_assembly.R
    Untracked:  dataredo.RData
    Untracked:  lcpm_filtered_corplot.pdf
    Untracked:  log2cpmfragcount.pdf
    Untracked:  output/cormotif_probability_45_list.csv
    Untracked:  output/cormotif_probability_all_6_list.csv
    Untracked:  output_1_Mecom.txt
    Untracked:  splited/
    Untracked:  trimmed_Ind1_75DA24h_S7.nodup.fragment.size.distribution.pdf
    Untracked:  trimmed_Ind1_75DA3h_S1.nodup.fragment.size.distribution.pdf
Note that any generated files, e.g. HTML, png, CSS, etc., are not included in this status report because it is ok for generated content to have uncommitted changes.
These are the previous versions of the repository in which changes were
made to the R Markdown (analysis/final_plot_attempt.Rmd)
and HTML (docs/final_plot_attempt.html) files. If you’ve
configured a remote Git repository (see ?wflow_git_remote),
click on the hyperlinks in the table below to view the files as they
were in that past version.
| File | Version | Author | Date | Message |
|---|---|---|---|---|
| Rmd | 0cdaa94 | reneeisnowhere | 2024-11-14 | adding in updates |
| Rmd | 84c2d63 | reneeisnowhere | 2024-11-14 | adding in commits |
| html | c959920 | reneeisnowhere | 2024-10-28 | Build site. |
| Rmd | c3af560 | reneeisnowhere | 2024-10-28 | updates to peaks/rna stuff |
| html | 90fa7d6 | reneeisnowhere | 2024-10-28 | Build site. |
| Rmd | 0c8593f | reneeisnowhere | 2024-10-28 | updates to new SNP associaitions |
| html | ad854f2 | reneeisnowhere | 2024-10-24 | Build site. |
| Rmd | d949388 | reneeisnowhere | 2024-10-24 | wflow_publish("analysis/final_plot_attempt.Rmd") |
| html | 6074022 | reneeisnowhere | 2024-10-17 | Build site. |
| Rmd | 00d7d3d | reneeisnowhere | 2024-10-17 | updates |
library(tidyverse)
library(kableExtra)
library(broom)
library(RColorBrewer)
library("TxDb.Hsapiens.UCSC.hg38.knownGene")
library("org.Hs.eg.db")
library(rtracklayer)
library(ggfortify)
library(readr)
library(BiocGenerics)
library(gridExtra)
library(VennDiagram)
library(scales)
library(ggVennDiagram)
library(BiocParallel)
library(ggpubr)
library(edgeR)
library(genomation)
library(ggsignif)
library(plyranges)
library(ggrepel)
library(ComplexHeatmap)
library(cowplot)
library(smplot2)
# toplistall_RNA <- readRDS("data/other_papers/toplistall_RNA.RDS")
# toplistall_RNA <- toplistall_RNA %>%
# mutate(logFC = logFC*(-1))
# toplist_ATAC <- readRDS("data/Final_four_data/toplist_ff.RDS")
Collapsed_H3k27ac_NG <- read_delim("data/Final_four_data/H3K27ac_files/Collapsed_H3k27ac_NG.txt",delim = "\t",col_names = TRUE)
Collapsed_new_peaks <- read_delim("data/Final_four_data/collapsed_new_peaks.txt", delim = "\t", col_names = TRUE)
RNA_median_3_lfc <- readRDS("data/other_papers/RNA_median_3_lfc.RDS")
RNA_median_24_lfc <- readRDS("data/other_papers/RNA_median_24_lfc.RDS")
overlap_df_ggplot <- readRDS("data/Final_four_data/LFC_ATAC_K27ac.RDS")
AC_median_3_lfc <- read_csv("data/Final_four_data/AC_median_3_lfc.csv")
AC_median_24_lfc <- read_csv("data/Final_four_data/AC_median_24_lfc.csv")
ATAC_24_lfc <- read_csv("data/Final_four_data/median_24_lfc.csv")
ATAC_3_lfc <- read_csv("data/Final_four_data/median_3_lfc.csv")
joined_LFC_df <- overlap_df_ggplot %>%
left_join(.,(Collapsed_new_peaks %>%
dplyr::select(Peakid,dist_to_NG, NCBI_gene:SYMBOL)),
by=c("peakid"="Peakid")) %>%
left_join(., RNA_median_3_lfc ,
# %>%
# dplyr::select(SYMBOL,RNA_3h_lfc)),
by=c("SYMBOL"="SYMBOL", "NCBI_gene"="ENTREZID")) %>%
left_join(., RNA_median_24_lfc,# %>%
# dplyr::select(SYMBOL,RNA_24h_lfc)),
by=c("SYMBOL"="SYMBOL", "NCBI_gene"="ENTREZID"))
lt1<- readRDS("data/Final_four_data/updated_RNA_gene_lookuptable")
checklist <- lt1 %>%
separate_longer_delim(.,col= ENTREZID, delim= ":") %>%
separate_longer_delim(.,col= SYMBOL, delim= ":") %>%
dplyr::select(ENTREZID,SYMBOL) %>%
mutate(ENTREZID=as.numeric(ENTREZID)) %>%
distinct()
# schneider_closest_output <- readRDS("data/other_papers/Schneider_closestgene_SNP_file.RDS") %>%
# left_join(., checklist, by=c("ENTREZID"="ENTREZID"))
# schneider_gr <- schneider_closest_output %>%
# dplyr::select(chrom,start,stop,RSID,ENTREZID) %>%
# left_join(., (checklist %>% mutate(ENTREZID=as.numeric(ENTREZID))) , by=c("ENTREZID"="ENTREZID")) %>%
# GRanges()
#
# schneider_10k_gr <- schneider_closest_output %>%
# mutate(start=(start-5000),stop=(stop+4999), width=10000) %>%
# dplyr::select(chrom,start,stop,RSID,ENTREZID) %>%
# left_join(., checklist , by=c("ENTREZID"="ENTREZID")) %>%
# GRanges()
# SNP_peak_check <- join_overlap_intersect(TSS_assigned_NG_gr,schneider_gr) %>%
# as.data.frame()
#
# SNP_peak_check_10k <- join_overlap_intersect(TSS_assigned_NG_gr,schneider_10k_gr) %>%
# as.data.frame()
new_SNP_peak_check_10k <- readRDS("data/Final_four_data/new_SNP_peak_check_10k.RDS")
new_SNP_peak_check <- readRDS("data/Final_four_data/new_SNP_peak_check.RDS")
point_only <- new_SNP_peak_check
# new_SNP_pc_gr <- new_SNP_peak_check_10k
new_SNP_peak_check_10k %>% dplyr::filter(ENTREZID.x !=ENTREZID.y) seqnames start end width strand Peakid NG_chr
1 chr8 141160879 141162083 1205 * chr8.141160879.141162083 chr8
NG_start NG_end.x NG_TSS ENTREZID.x SYMBOL.x dist_to_NG Variation
1 141117277 141195808 141117278 22898 DENND3 -43602 rs428300
RSID ENTREZID.y SYMBOL.y TSS_chr TSS_start TSS_end NG_end.y
1 rs428300 57210 SLC45A4 chr8 141207165 141207166 141308305
dist_SNP_NG_TSS
1 43909# schneider_gr %>% write_bed(.,"data/Final_four_data/meme_bed/Schnieder_SNPs.bed")
ATAC_peaks_gr <- Collapsed_new_peaks %>% GRanges()
# point_only <- join_overlap_intersect(schneider_gr,ATAC_peaks_gr)
# expand_schneider <- join_overlap_intersect(ATAC_peaks_gr,schneider_10k_gr)
library(readxl)
Reheat_data <- read_excel("data/other_papers/jah36123-sup-0002-tables2.xlsx")
top_reheat <- Reheat_data %>%
dplyr::filter(fisher_pvalue<0.005)
schneider_short_list <- point_only %>% as.data.frame
#
# peakAnnoList_ff_motif <- readRDS("data/Final_four_data/peakAnnoList_ff_motif.RDS")
#
# background_peaks <- as.data.frame(peakAnnoList_ff_motif$background)
# EAR_df <- as.data.frame(peakAnnoList_ff_motif$EAR)
# ESR_df <- as.data.frame(peakAnnoList_ff_motif$ESR)
# LR_df <- as.data.frame(peakAnnoList_ff_motif$LR)
# NR_df <- as.data.frame(peakAnnoList_ff_motif$NR)
# open_3med <- ATAC_3_lfc %>%
# dplyr::filter(med_3h_lfc > 0)
#
# close_3med <- ATAC_3_lfc %>%
# dplyr::filter(med_3h_lfc < 0)
#
# open_24med <- ATAC_24_lfc %>%
# dplyr::filter(med_24h_lfc > 0)
#
# close_24med <- ATAC_24_lfc %>%
# dplyr::filter(med_24h_lfc < 0)
#
# medA <- ATAC_3_lfc %>%
# left_join(ATAC_24_lfc, by=c("peak"="peak")) %>%
# dplyr::filter(med_3h_lfc > 0 & med_24h_lfc>0)
#
# medB <- ATAC_3_lfc %>%
# left_join(ATAC_24_lfc, by=c("peak"="peak")) %>%
# dplyr::filter(med_3h_lfc < 0 & med_24h_lfc < 0)
#
# medC <- ATAC_3_lfc %>%
# left_join(ATAC_24_lfc, by=c("peak"="peak")) %>%
# dplyr::filter(med_3h_lfc > 0& med_24h_lfc <0)
#
#
# medD <- ATAC_3_lfc %>%
# left_join(ATAC_24_lfc, by=c("peak"="peak"))%>%
# dplyr::filter(med_3h_lfc < 0 & med_24h_lfc > 0)
Nine_te_df <- readRDS("data/Final_four_data/Nine_group_TE_df.RDS")
match <- Nine_te_df %>% distinct(Peakid,TEstatus,mrc,.keep_all = TRUE)
# NR <- NR_df %>% dplyr::select(Peakid)
# EAR_open <- EAR_df %>% dplyr::select(Peakid) %>% dplyr::filter(Peakid %in% open_3med$peak)
# EAR_close <-EAR_df %>% dplyr::select(Peakid) %>% dplyr::filter(Peakid %in% close_3med$peak)
# ESR_open <- ESR_df %>% dplyr::select(Peakid) %>% dplyr::filter(Peakid %in% medA$peak)
# ESR_close <- ESR_df %>% dplyr::select(Peakid) %>% dplyr::filter(Peakid %in% medB$peak)
# LR_open <- LR_df %>% dplyr::select(Peakid) %>% dplyr::filter(Peakid %in% open_24med$peak)
# LR_close <- LR_df %>% dplyr::select(Peakid) %>% dplyr::filter(Peakid %in% open_24med$peak)
# ESR_opcl <- ESR_df %>% dplyr::select(Peakid) %>% dplyr::filter(Peakid %in% medC$peak)
# ESR_clop <- ESR_df %>% dplyr::select(Peakid) %>% dplyr::filter(Peakid %in% medD$peak)
# expand_schneider %>% as.data.frame() %>%
# dplyr::select(Peakid,RSID,NCBI_gene:SYMBOL.y) %>% dplyr::filter(grepl("rs425*", RSID))
Knowles_dox_eQTL <- readRDS("data/Knowles_5.RDS")
Knowles_mar_eQTL <- readRDS("data/Knowles_4.RDS")
dox_eQTL_gr <- Knowles_dox_eQTL %>%
distinct(RSID,.keep_all = TRUE) %>%
mutate(CHR_ID=(gsub("chr","",chr))) %>%
dplyr::rename("SNPS"=RSID,"CHR_POS"=pos) %>%
dplyr::select(CHR_ID, CHR_POS,SNPS) %>%
mutate(CHR_ID=as.numeric(CHR_ID), CHR_POS=as.numeric(CHR_POS)) %>%
na.omit() %>%
mutate(gwas="eQTL") %>%
mutate(start=CHR_POS, end=CHR_POS, chr=paste0("chr",CHR_ID)) %>%
GRanges()
mar_eQTL_gr <- Knowles_mar_eQTL %>%
distinct(RSID,.keep_all = TRUE) %>%
mutate(CHR_ID=(gsub("chr","",chr))) %>%
dplyr::rename("SNPS"=RSID,"CHR_POS"=pos) %>%
dplyr::select(CHR_ID, CHR_POS,SNPS) %>%
mutate(gwas="beQTL") %>%
mutate(CHR_ID=as.numeric(CHR_ID), CHR_POS=as.numeric(CHR_POS)) %>%
na.omit() %>%
mutate(start=CHR_POS, end=CHR_POS, chr=paste0("chr",CHR_ID)) %>%
GRanges()
mar_eqtl_SNPS <-
join_overlap_intersect(ATAC_peaks_gr,mar_eQTL_gr) %>%
as.data.frame()
dox_eqtl_SNPs <-
join_overlap_intersect(ATAC_peaks_gr,dox_eQTL_gr) %>%
as.data.frame()
test <- dox_eqtl_SNPs %>%
dplyr::filter(Peakid %in% new_SNP_peak_check_10k$Peakid)
join_overlap_intersect((new_SNP_peak_check_10k %>% GRanges() ),mar_eQTL_gr) %>%
as.data.frame() [1] seqnames start end width
[5] strand Peakid NG_chr NG_start
[9] NG_end.x NG_TSS ENTREZID.x SYMBOL.x
[13] dist_to_NG Variation RSID ENTREZID.y
[17] SYMBOL.y TSS_chr TSS_start TSS_end
[21] NG_end.y dist_SNP_NG_TSS CHR_ID CHR_POS
[25] SNPS gwas
<0 rows> (or 0-length row.names)schneider_df <-
new_SNP_peak_check_10k%>% as.data.frame() %>%
dplyr::select(Peakid,RSID,ENTREZID.x:dist_to_NG,ENTREZID.y:SYMBOL.y, dist_SNP_NG_TSS) %>%
mutate(SYMBOL=if_else(is.na(SYMBOL.y),SYMBOL.x,SYMBOL.y)) %>%
mutate(ENTREZID=if_else(is.na(ENTREZID.y),ENTREZID.x,ENTREZID.y))%>%
dplyr::select(Peakid, RSID, ENTREZID, SYMBOL) %>%
distinct(Peakid,RSID,.keep_all = TRUE) %>%
# left_join(., joined_LFC_df,by = c("Peakid"="peakid", "ENTREZID"="NCBI_gene","SYMBOL"="SYMBOL")) #%>%
# dplyr::select(Peakid:Geneid, AC_3h_lfc, AC_24h_lfc) %>%
left_join(., (ATAC_3_lfc %>% dplyr::select(peak,med_3h_lfc)),by=c("Peakid"="peak")) %>%
left_join(., (ATAC_24_lfc %>% dplyr::select(peak,med_24h_lfc)),by=c("Peakid"="peak"))%>%
### peaks left out here were chopped due to low counts (row_means<0) %>%
mutate(ENTREZID= if_else(RSID=="rs36022097","8970",ENTREZID),
SYMBOL=if_else(RSID=="rs36022097","H2BC11",SYMBOL)) %>%
dplyr::filter(!is.na(med_24h_lfc)) %>%
left_join(., RNA_median_3_lfc,by =c("ENTREZID"="ENTREZID")) %>%
left_join(., RNA_median_24_lfc,by =c("ENTREZID"="ENTREZID", "SYMBOL.y"="SYMBOL")) %>%
mutate(reheat=if_else(SYMBOL.x %in% Reheat_data$gene,"reheat_gene","not_reheat_gene")) %>%
dplyr::filter(!is.na(med_3h_lfc)) %>%
distinct(RSID,.keep_all = TRUE) %>%
dplyr::select(RSID,Peakid,med_3h_lfc,med_24h_lfc,,RNA_3h_lfc,RNA_24h_lfc, ENTREZID,SYMBOL.x,reheat) %>% #AC_3h_lfc,AC_24h_lfc) %>%
tidyr::unite(name,RSID,SYMBOL.x,Peakid,sep ="_",remove=FALSE) %>%
left_join(.,(match %>%
group_by(Peakid) %>%
filter(!(TEstatus=="not_TE_peak" & any (TEstatus == "TE_peak"))) %>%
ungroup() %>%
distinct(TEstatus,Peakid,.keep_all = TRUE)),
by = c("Peakid"="Peakid")) %>%
group_by(Peakid) %>%
summarize(name=unique(name),
RSID=unique(RSID),
med_3h_lfc=unique(med_3h_lfc),
med_24h_lfc=unique(med_24h_lfc),
# AC_3h_lfc=unique(AC_3h_lfc),
# AC_24h_lfc=unique(AC_24h_lfc),
RNA_3h_lfc=unique(RNA_3h_lfc),
RNA_24h_lfc=unique(RNA_24h_lfc),
repClass=paste(unique(repClass),collapse=":"),
TEstatus=paste(unique(TEstatus),collapse=";"),
SYMBOL.x=paste(unique(SYMBOL.x),collapse=";"),
reheat=paste(unique(reheat),collapse=";"),
mrc=unique(mrc)) %>%
mutate(point_ol=if_else(RSID %in% point_only$RSID,"yes","no")) %>%
mutate(eQTL=if_else(RSID %in% dox_eqtl_SNPs$SNPS,"yes",if_else(Peakid %in% mar_eqtl_SNPS$Peakid,"yes","no")))
schneider_mat <- schneider_df %>%
ungroup() %>%
dplyr::select(name,med_3h_lfc:RNA_24h_lfc) %>%
column_to_rownames("name") %>%
as.matrix()
schneider_name_mat <- schneider_df %>%
ungroup() %>%
dplyr::select(name,TEstatus,mrc,reheat,point_ol)
row_anno <- ComplexHeatmap::rowAnnotation(TE_status=schneider_name_mat$TEstatus,reheat_status=schneider_name_mat$reheat,MRC=schneider_name_mat$mrc,direct_overlap=schneider_name_mat$point_ol,col= list(TE_status= c("TE_peak"="goldenrod","TE_peak;not_TE_peak"="goldenrod","not_TE_peak;TE_peak"="goldenrod","not_TE_peak"="lightblue"),
MRC = c("EAR_open" = "#F8766D", "EAR_close" = "#f6483c",
"ESR_open" = "#7CAE00",
"ESR_close" = "#587b00",
"ESR_opcl"="grey40",
"ESR_C"="grey40",
"ESR_clop"="tan",
"ESR_D"="tan",
"ESR_OC" = "#6a9500",
"LR_open" = "#00BFC4",
"LR_close" = "#008d91",
"NR" = "#C77CFF",
"not_mrc"="black"
),
reheat_status=c("reheat_gene"="green","not_reheat_gene"="orange")
),direct_overlap=c("yes"="red","no"="grey8"))
ComplexHeatmap::Heatmap(schneider_mat,
left_annotation = row_anno,
show_row_names = TRUE,
show_column_names = TRUE,cluster_rows = FALSE,cluster_columns = FALSE)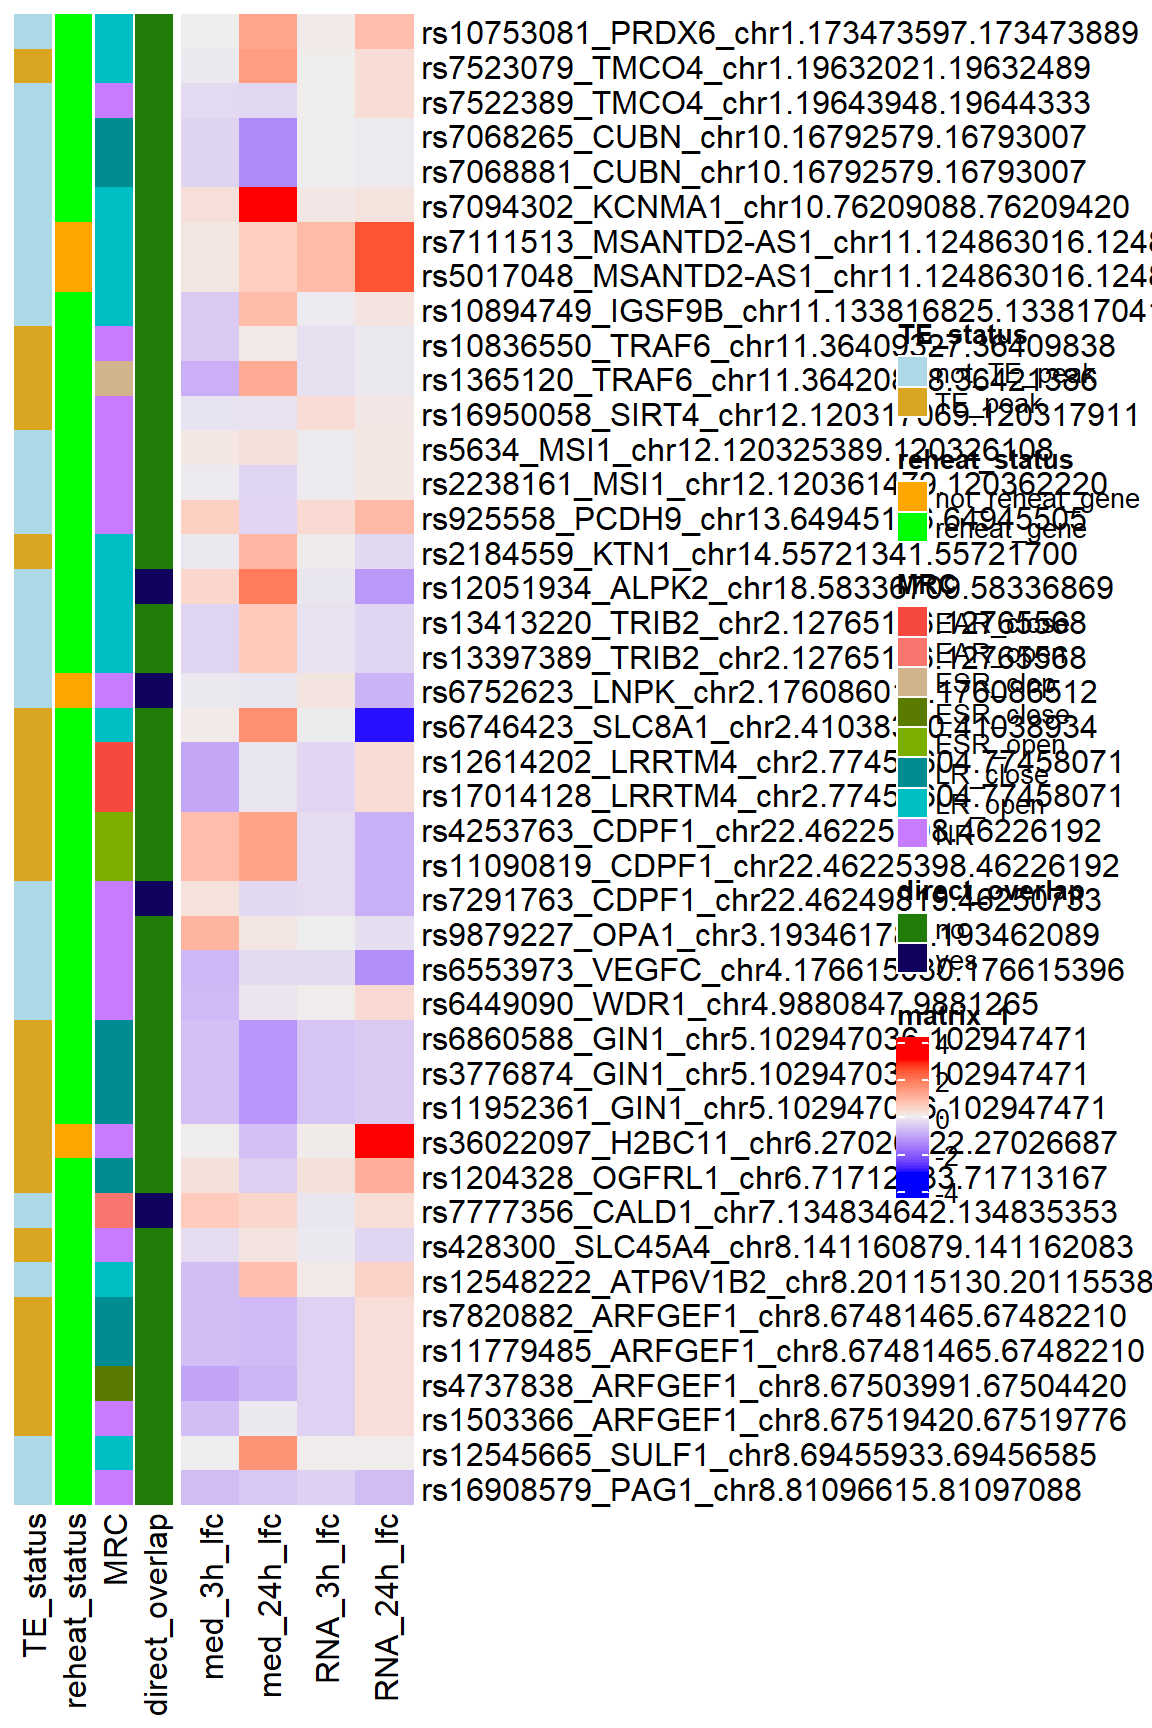 #### GWAS SNP overlap log2cpm
TTN
drug_pal <- c("#8B006D","#DF707E","#F1B72B", "#3386DD","#707031","#41B333")
# K27_counts <-  readRDS("data/Final_four_data/All_Raodahpeaks.RDS")
ATAC_counts <- readRDS("data/Final_four_data/x4_filtered.RDS")
RNA_counts <- readRDS("data/other_papers/Counts_RNA_ERMatthews.RDS")
# overlap_atac_ac_peaks <- readRDS( "data/Final_four_data/overlapping_ac_atac_peaks.RDS")
TNT_peak <- data.frame(peak="chr2.178547784.178549172", RNA="TTN", ENTREZID=7273)
 AS1 <- 100506866
RNA_counts %>%
  column_to_rownames("ENTREZID") %>%
  cpm(., log = TRUE) %>%
  as.data.frame() %>%
  dplyr::filter(row.names(.) %in% TNT_peak$ENTREZID) %>%
  mutate(ENTREZID = row.names(.)) %>%
  pivot_longer(cols = !ENTREZID, names_to = "sample", values_to = "counts") %>%
  separate("sample", into = c("trt","ind","time")) %>%
  mutate(time=factor(time, levels = c("3h","24h"))) %>%
  mutate(trt=factor(trt, levels= c("DOX","EPI","DNR","MTX","TRZ","VEH"))) %>%
  ggplot(., aes (x = time, y=counts))+
  geom_boxplot(aes(fill=trt))+
  ggtitle("Titin (TTN) RNA expression")+
  scale_fill_manual(values = drug_pal)+
  theme_bw()+
  ylab("log2 cpm RNA")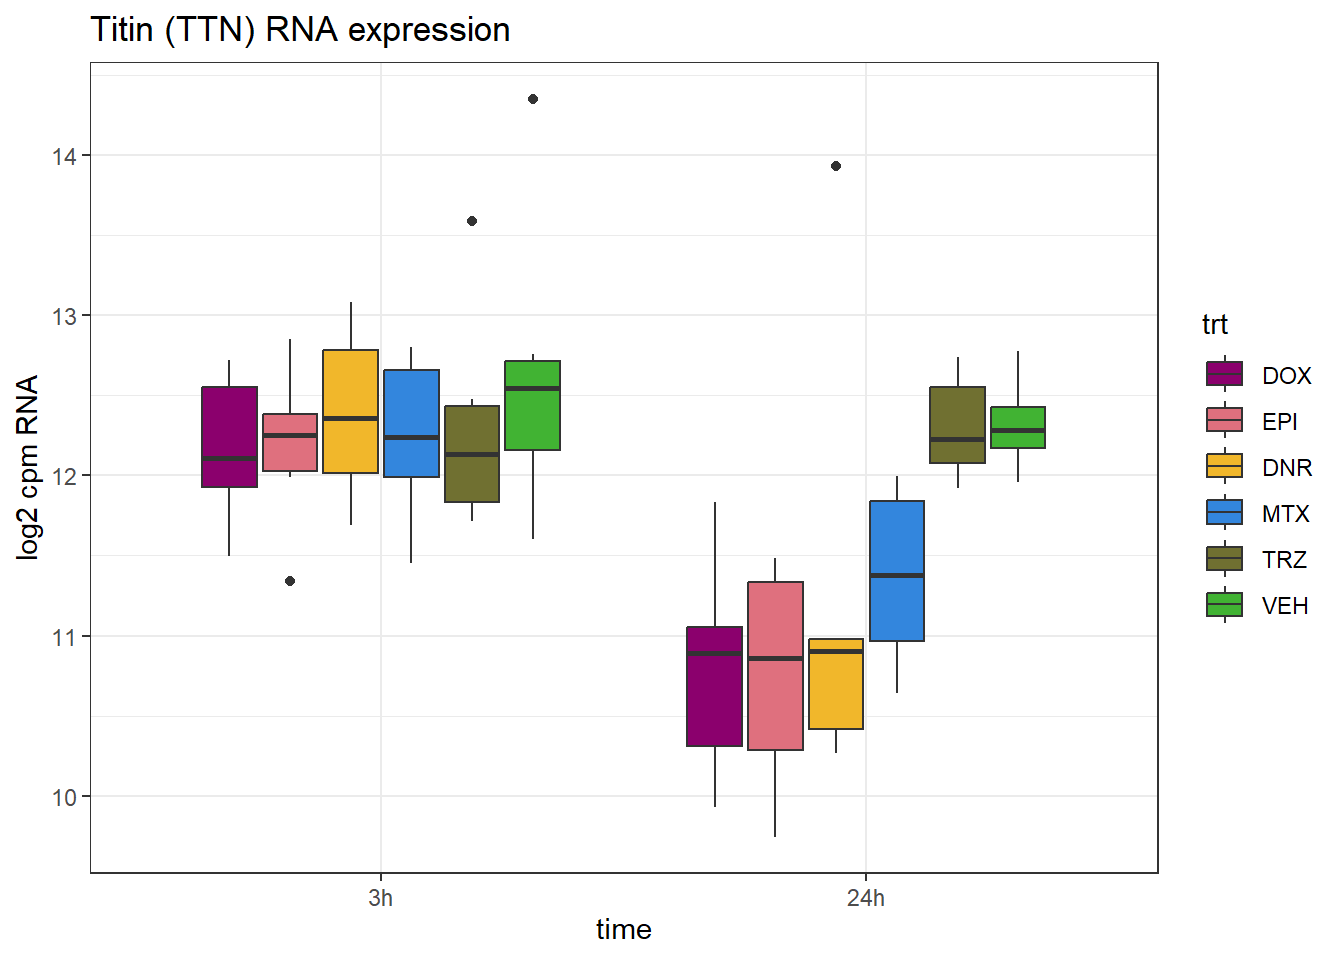
| Version | Author | Date |
|---|---|---|
| 6074022 | reneeisnowhere | 2024-10-17 |
RNA_counts %>%
  column_to_rownames("ENTREZID") %>%
  cpm(., log = TRUE) %>%
  as.data.frame() %>%
  dplyr::filter(row.names(.) %in% AS1) %>%
  mutate(ENTREZID = row.names(.)) %>%
  pivot_longer(cols = !ENTREZID, names_to = "sample", values_to = "counts") %>%
  separate("sample", into = c("trt","ind","time")) %>%
  mutate(time=factor(time, levels = c("3h","24h"))) %>%
  mutate(trt=factor(trt, levels= c("DOX","EPI","DNR","MTX","TRZ","VEH"))) %>%
  ggplot(., aes (x = time, y=counts))+
  geom_boxplot(aes(fill=trt))+
  ggtitle("Titin-AS1 (TTN-AS1) RNA expression")+
  scale_fill_manual(values = drug_pal)+
  theme_bw()+
  ylab("log2 cpm RNA")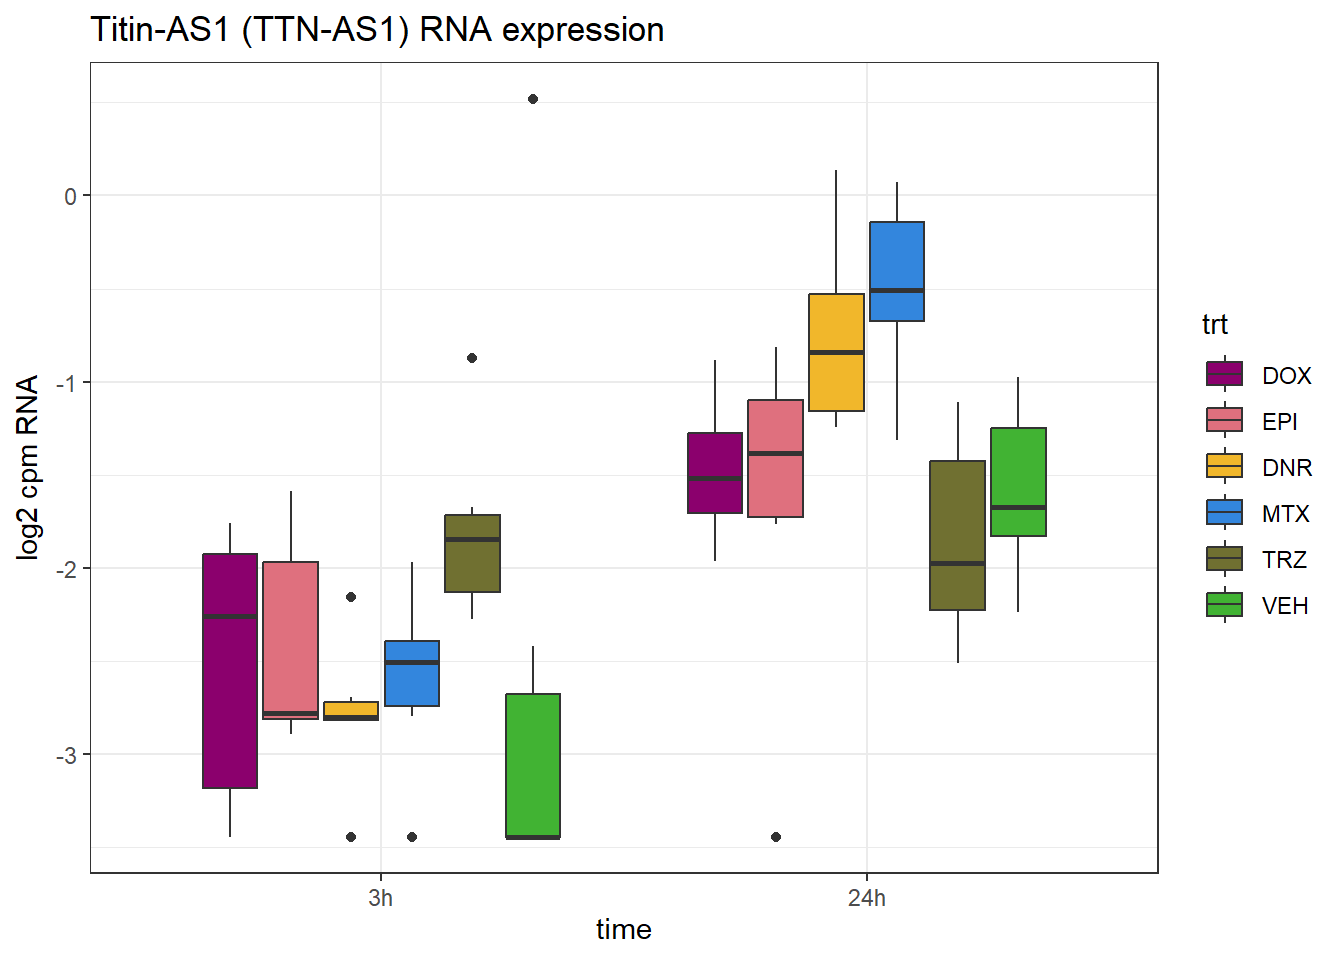
ATAC_counts %>%
  cpm(., log = TRUE) %>%
   as.data.frame() %>%
  rename_with(.,~gsub(pattern = "Ind1_75", replacement = "1_",.)) %>%
  rename_with(.,~gsub(pattern = "Ind2_87", replacement = "2_",.)) %>%
  rename_with(.,~gsub(pattern = "Ind3_77", replacement = "3_",.)) %>%
  rename_with(.,~gsub(pattern = "Ind6_71", replacement = "6_",.)) %>%
  rename_with(.,~gsub( "DX" ,'DOX',.)) %>%
  rename_with(.,~gsub( "DA" ,'DNR',.)) %>%
  rename_with(.,~gsub( "E" ,'EPI',.)) %>%
  rename_with(.,~gsub( "T" ,'TRZ',.)) %>%
  rename_with(.,~gsub( "M" ,'MTX',.)) %>%
  rename_with(.,~gsub( "V" ,'VEH',.)) %>%
  rename_with(.,~gsub("24h","_24h",.)) %>%
  rename_with(.,~gsub("3h","_3h",.)) %>%
  dplyr::filter(row.names(.) %in% TNT_peak$peak) %>%
  mutate(Peakid = row.names(.)) %>%
  pivot_longer(cols = !Peakid, names_to = "sample", values_to = "counts") %>%
  separate("sample", into = c("ind","trt","time")) %>%
  mutate(time=factor(time, levels = c("3h","24h"))) %>%
  mutate(trt=factor(trt, levels= c("DOX","EPI","DNR","MTX","TRZ","VEH"))) %>%
  ggplot(., aes (x = time, y=counts))+
  geom_boxplot(aes(fill=trt))+
  ggtitle("Titin (TTN) ATAC accessibility")+
  scale_fill_manual(values = drug_pal)+
  theme_bw()+
  ylab("log2 cpm ATAC")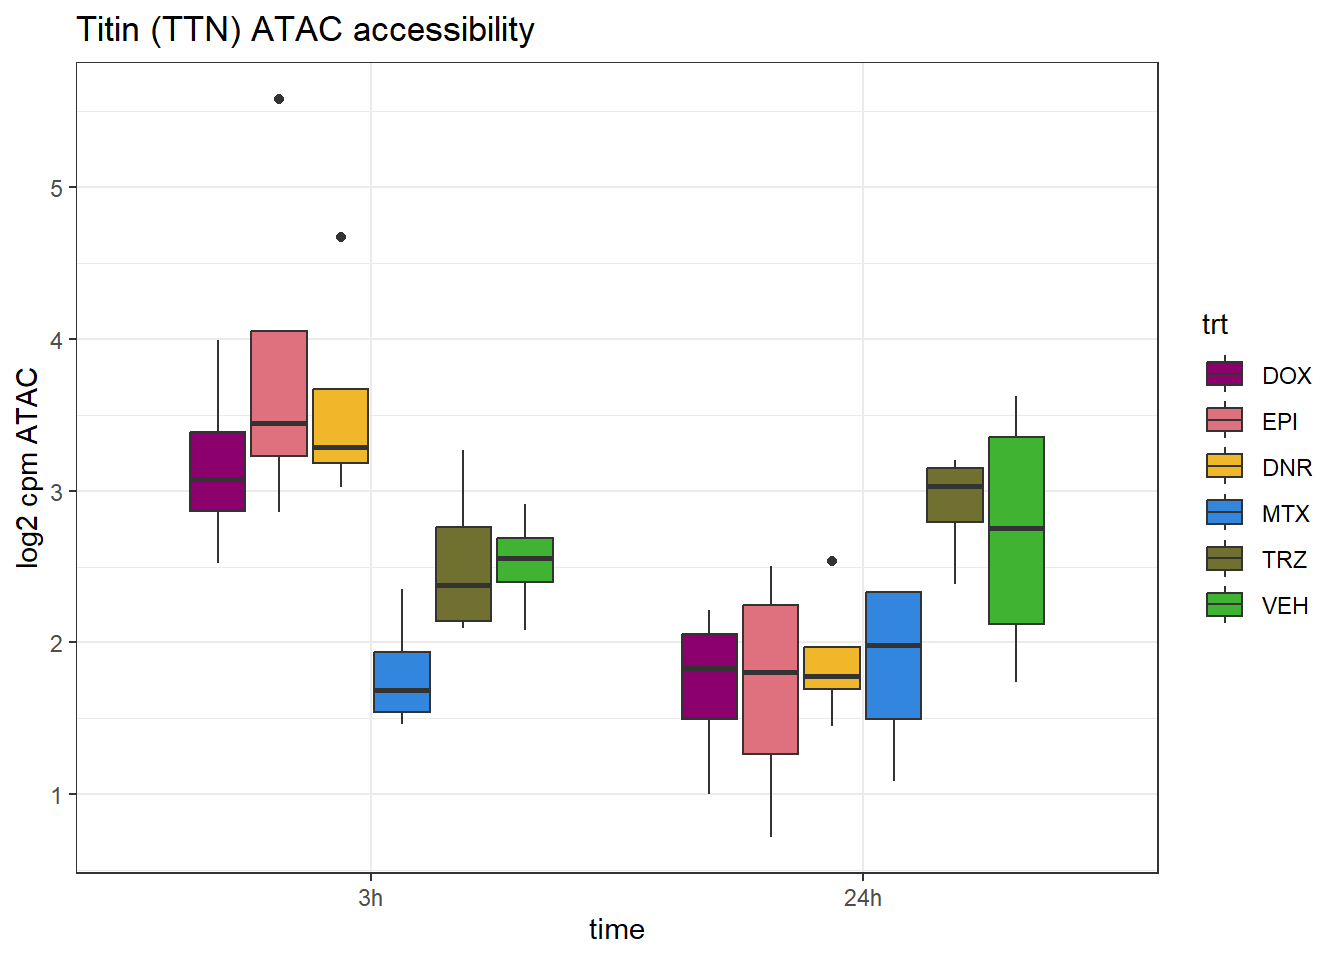
| Version | Author | Date |
|---|---|---|
| ad854f2 | reneeisnowhere | 2024-10-24 |
IGSFB9
IGSF9B_peak <- data.frame(peak="chr11.133816825.133817041", RNA="IGSFB9", ENTREZID=22997)

RNA_counts %>%
  column_to_rownames("ENTREZID") %>%
  cpm(., log = TRUE) %>%
  as.data.frame() %>%
  dplyr::filter(row.names(.) %in% IGSF9B_peak$ENTREZID) %>%
  mutate(ENTREZID = row.names(.)) %>%
  pivot_longer(cols = !ENTREZID, names_to = "sample", values_to = "counts") %>%
  separate("sample", into = c("trt","ind","time")) %>%
  mutate(time=factor(time, levels = c("3h","24h"))) %>%
  mutate(trt=factor(trt, levels= c("DOX","EPI","DNR","MTX","TRZ","VEH"))) %>%
  ggplot(., aes (x = time, y=counts))+
  geom_boxplot(aes(fill=trt))+
  ggtitle("IGSF9B RNA expression")+
  scale_fill_manual(values = drug_pal)+
  theme_bw()+
  ylab("log2 cpm RNA")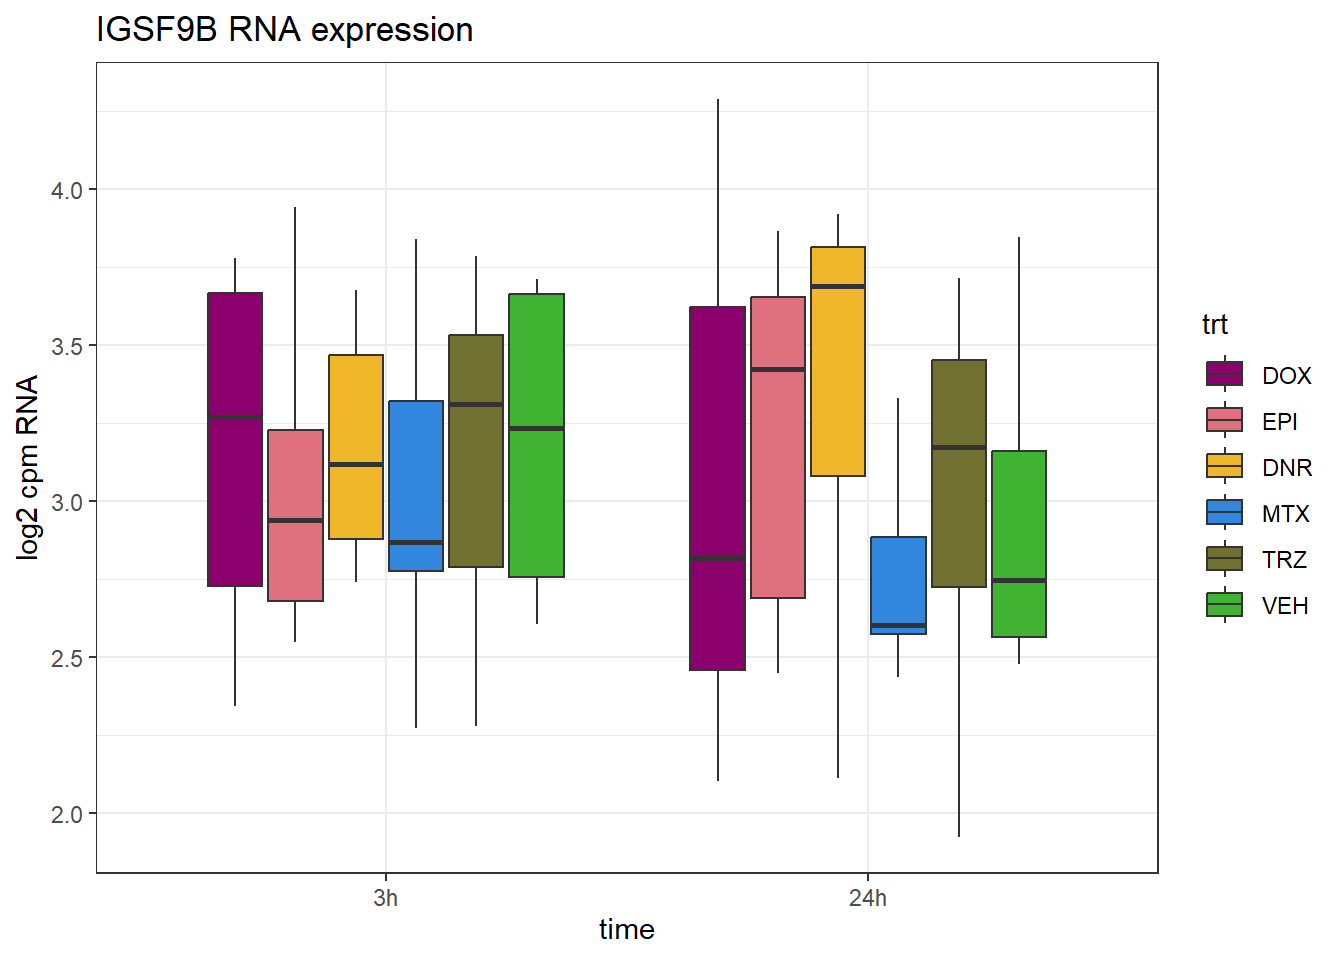
| Version | Author | Date |
|---|---|---|
| ad854f2 | reneeisnowhere | 2024-10-24 |
ATAC_counts %>%
  cpm(., log = TRUE) %>%
   as.data.frame() %>%
  rename_with(.,~gsub(pattern = "Ind1_75", replacement = "1_",.)) %>%
  rename_with(.,~gsub(pattern = "Ind2_87", replacement = "2_",.)) %>%
  rename_with(.,~gsub(pattern = "Ind3_77", replacement = "3_",.)) %>%
  rename_with(.,~gsub(pattern = "Ind6_71", replacement = "6_",.)) %>%
  rename_with(.,~gsub( "DX" ,'DOX',.)) %>%
  rename_with(.,~gsub( "DA" ,'DNR',.)) %>%
  rename_with(.,~gsub( "E" ,'EPI',.)) %>%
  rename_with(.,~gsub( "T" ,'TRZ',.)) %>%
  rename_with(.,~gsub( "M" ,'MTX',.)) %>%
  rename_with(.,~gsub( "V" ,'VEH',.)) %>%
  rename_with(.,~gsub("24h","_24h",.)) %>%
  rename_with(.,~gsub("3h","_3h",.)) %>%
  dplyr::filter(row.names(.) %in% IGSF9B_peak$peak) %>%
  mutate(Peakid = row.names(.)) %>%
  pivot_longer(cols = !Peakid, names_to = "sample", values_to = "counts") %>%
  separate("sample", into = c("ind","trt","time")) %>%
  mutate(time=factor(time, levels = c("3h","24h"))) %>%
  mutate(trt=factor(trt, levels= c("DOX","EPI","DNR","MTX","TRZ","VEH"))) %>%
  ggplot(., aes (x = time, y=counts))+
  geom_boxplot(aes(fill=trt))+
  ggtitle("IGSF9B ATAC accessibility")+
  scale_fill_manual(values = drug_pal)+
  theme_bw()+
  ylab("log2 cpm ATAC")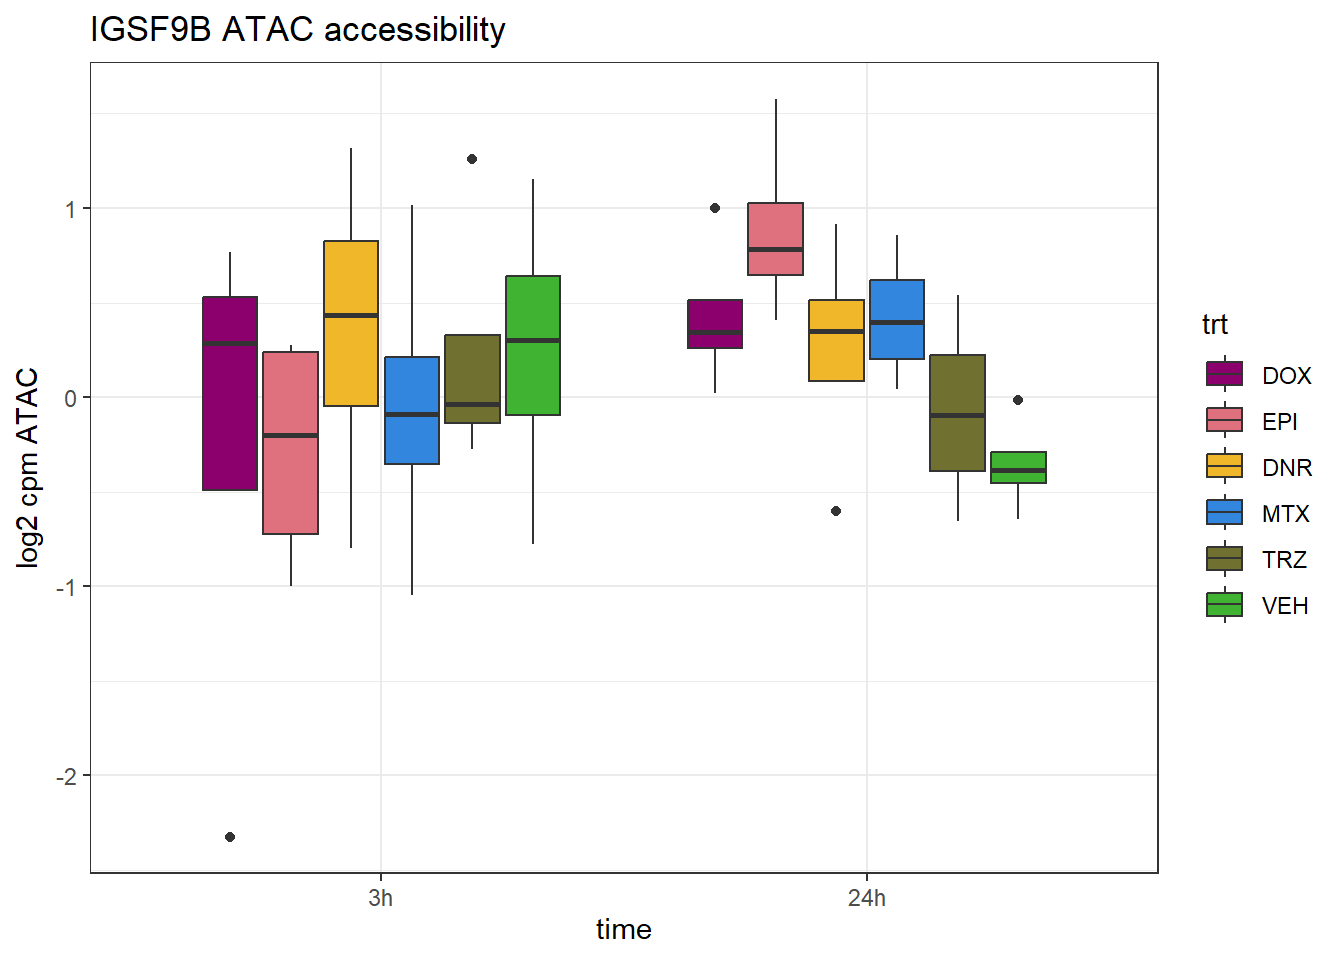
schneider_df# A tibble: 43 × 14
# Groups: Peakid [35]
Peakid name RSID med_3h_lfc med_24h_lfc RNA_3h_lfc RNA_24h_lfc repClass
<chr> <chr> <chr> <dbl> <dbl> <dbl> <dbl> <chr>
1 chr1.1734… rs10… rs10… 0.0209 1.28 0.0781 0.841 LINE
2 chr1.1963… rs75… rs75… -0.0841 1.40 0.0279 0.301 Other
3 chr1.1964… rs75… rs75… -0.282 -0.320 0.0279 0.301 NA
4 chr10.167… rs70… rs70… -0.386 -1.43 0.0107 -0.0511 NA
5 chr10.167… rs70… rs70… -0.386 -1.43 0.0107 -0.0511 NA
6 chr10.762… rs70… rs70… 0.268 3.24 0.126 0.202 SINE
7 chr11.124… rs71… rs71… 0.162 0.574 0.904 2.48 NA
8 chr11.124… rs50… rs50… 0.162 0.574 0.904 2.48 NA
9 chr11.133… rs10… rs10… -0.513 0.888 -0.0506 0.198 LTR
10 chr11.364… rs10… rs10… -0.524 0.0904 -0.194 -0.102 SINE
# ℹ 33 more rows
# ℹ 6 more variables: TEstatus <chr>, SYMBOL.x <chr>, reheat <chr>, mrc <chr>,
# point_ol <chr>, eQTL <chr>rs12051934 ALPK2
ALPK2_peak <- data.frame(peak="chr18.58336709.58336869", RNA="ALPK2", ENTREZID=115701)

RNA_counts %>%
  column_to_rownames("ENTREZID") %>%
  cpm(., log = TRUE) %>%
  as.data.frame() %>%
  dplyr::filter(row.names(.) %in% ALPK2_peak$ENTREZID) %>%
  mutate(ENTREZID = row.names(.)) %>%
  pivot_longer(cols = !ENTREZID, names_to = "sample", values_to = "counts") %>%
  separate("sample", into = c("trt","ind","time")) %>%
  mutate(time=factor(time, levels = c("3h","24h"))) %>%
  mutate(trt=factor(trt, levels= c("DOX","EPI","DNR","MTX","TRZ","VEH"))) %>%
  ggplot(., aes (x = time, y=counts))+
  geom_boxplot(aes(fill=trt))+
  ggtitle("ALPK2 RNA expression")+
  scale_fill_manual(values = drug_pal)+
  theme_bw()+
  ylab("log2 cpm RNA")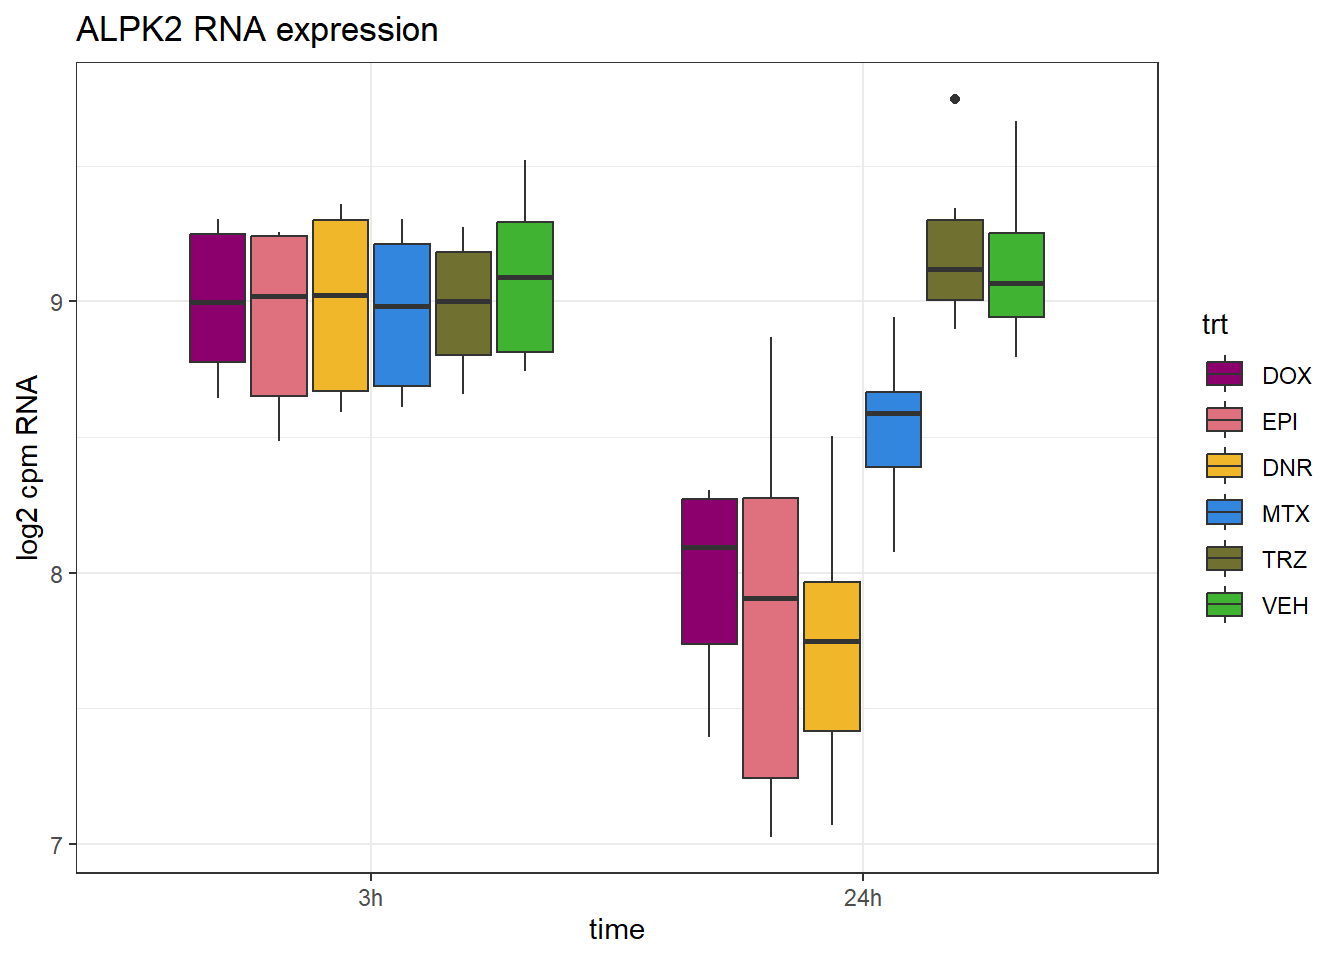
| Version | Author | Date |
|---|---|---|
| c959920 | reneeisnowhere | 2024-10-28 |
ATAC_counts %>%
  cpm(., log = TRUE) %>%
   as.data.frame() %>%
  rename_with(.,~gsub(pattern = "Ind1_75", replacement = "1_",.)) %>%
  rename_with(.,~gsub(pattern = "Ind2_87", replacement = "2_",.)) %>%
  rename_with(.,~gsub(pattern = "Ind3_77", replacement = "3_",.)) %>%
  rename_with(.,~gsub(pattern = "Ind6_71", replacement = "6_",.)) %>%
  rename_with(.,~gsub( "DX" ,'DOX',.)) %>%
  rename_with(.,~gsub( "DA" ,'DNR',.)) %>%
  rename_with(.,~gsub( "E" ,'EPI',.)) %>%
  rename_with(.,~gsub( "T" ,'TRZ',.)) %>%
  rename_with(.,~gsub( "M" ,'MTX',.)) %>%
  rename_with(.,~gsub( "V" ,'VEH',.)) %>%
  rename_with(.,~gsub("24h","_24h",.)) %>%
  rename_with(.,~gsub("3h","_3h",.)) %>%
  dplyr::filter(row.names(.) %in% ALPK2_peak$peak) %>%
  mutate(Peakid = row.names(.)) %>%
  pivot_longer(cols = !Peakid, names_to = "sample", values_to = "counts") %>%
  separate("sample", into = c("ind","trt","time")) %>%
  mutate(time=factor(time, levels = c("3h","24h"))) %>%
  mutate(trt=factor(trt, levels= c("DOX","EPI","DNR","MTX","TRZ","VEH"))) %>%
  ggplot(., aes (x = time, y=counts))+
  geom_boxplot(aes(fill=trt))+
  ggtitle("ALPK2 ATAC accessibility")+
  scale_fill_manual(values = drug_pal)+
  theme_bw()+
  ylab("log2 cpm ATAC")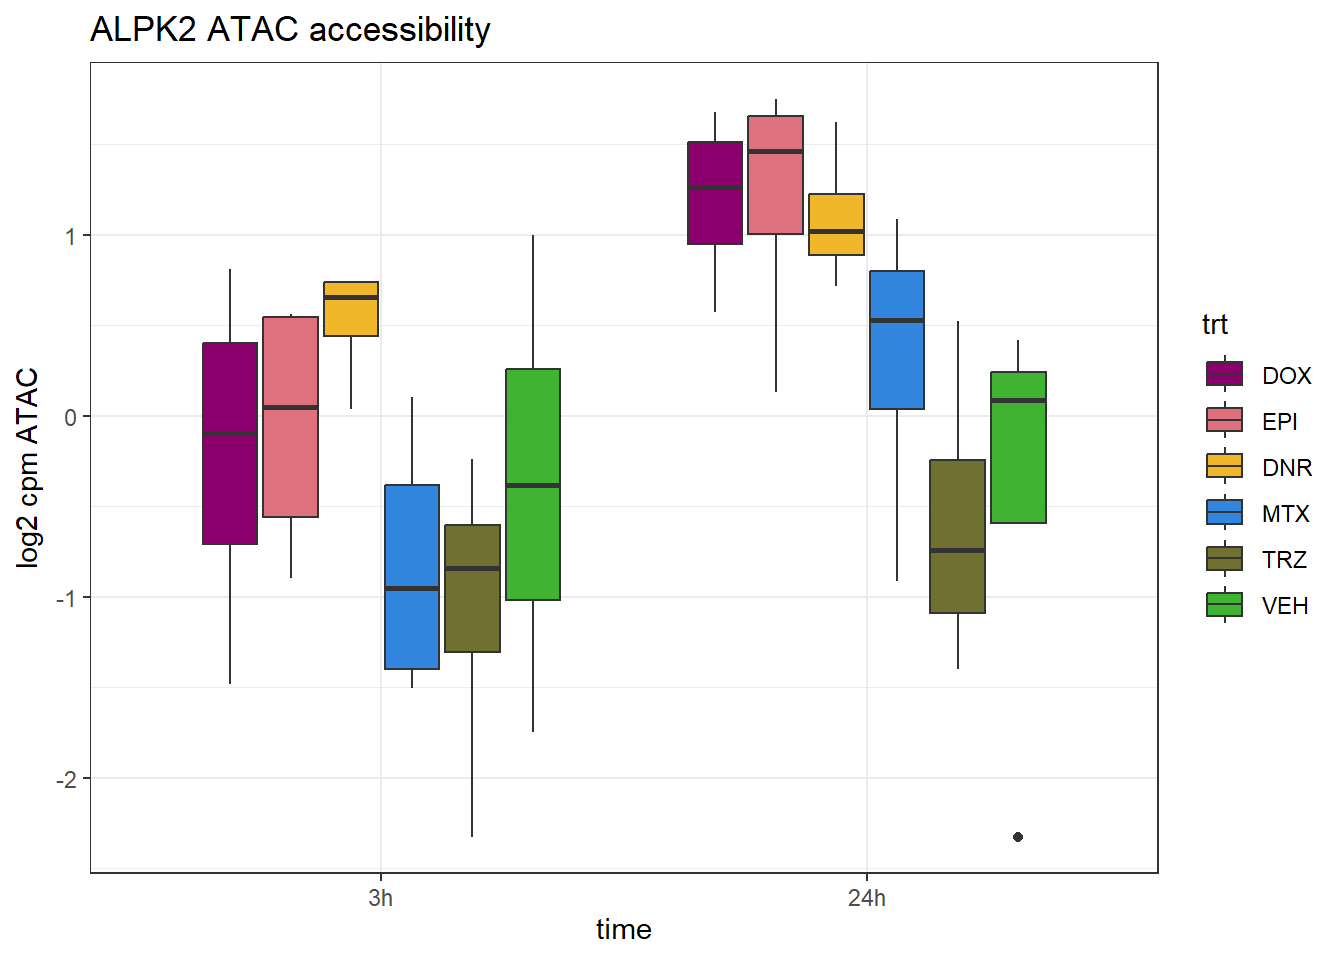
| Version | Author | Date |
|---|---|---|
| c959920 | reneeisnowhere | 2024-10-28 |
rs4916358 PRDX6
schneider_df %>% dplyr::filter(SYMBOL.x=="PRDX6")# A tibble: 1 × 14
# Groups: Peakid [1]
Peakid name RSID med_3h_lfc med_24h_lfc RNA_3h_lfc RNA_24h_lfc repClass
<chr> <chr> <chr> <dbl> <dbl> <dbl> <dbl> <chr>
1 chr1.17347… rs10… rs10… 0.0209 1.28 0.0781 0.841 LINE
# ℹ 6 more variables: TEstatus <chr>, SYMBOL.x <chr>, reheat <chr>, mrc <chr>,
# point_ol <chr>, eQTL <chr>PRDX6_peak <- data.frame(peak="chr1.173473597.173473889", RNA="PRDX6", ENTREZID=9588)
RNA_counts %>%
column_to_rownames("ENTREZID") %>%
cpm(., log = TRUE) %>%
as.data.frame() %>%
dplyr::filter(row.names(.) %in% PRDX6_peak$ENTREZID) %>%
mutate(ENTREZID = row.names(.)) %>%
pivot_longer(cols = !ENTREZID, names_to = "sample", values_to = "counts") %>%
separate("sample", into = c("trt","ind","time")) %>%
mutate(time=factor(time, levels = c("3h","24h"))) %>%
mutate(trt=factor(trt, levels= c("DOX","EPI","DNR","MTX","TRZ","VEH"))) %>%
ggplot(., aes (x = time, y=counts))+
geom_boxplot(aes(fill=trt))+
ggtitle(paste(PRDX6_peak$RNA," RNA expression"))+
scale_fill_manual(values = drug_pal)+
theme_bw()+
ylab("log2 cpm RNA")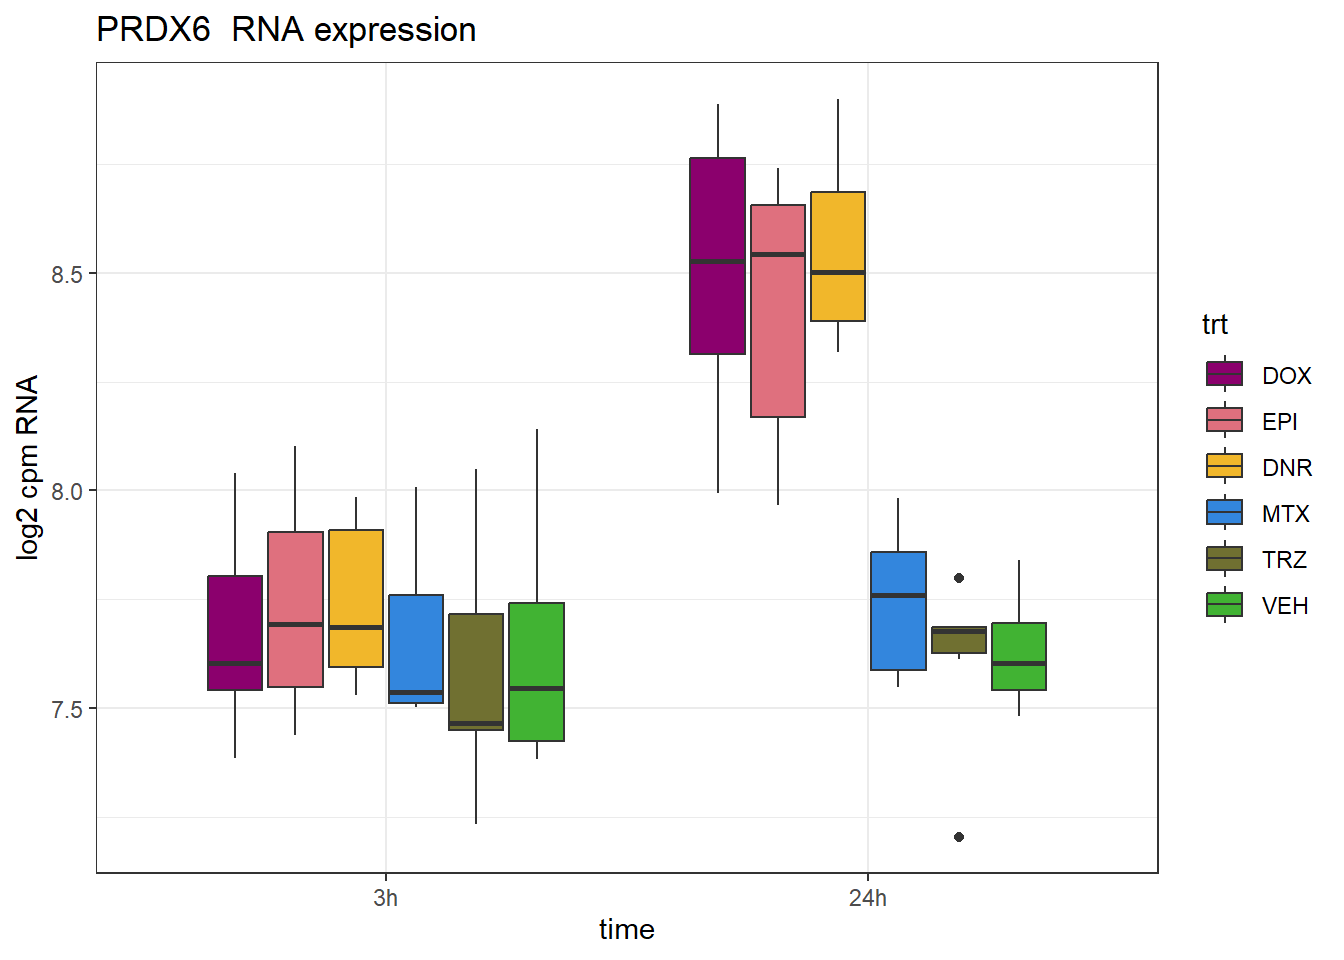
| Version | Author | Date |
|---|---|---|
| ad854f2 | reneeisnowhere | 2024-10-24 |
plotpanelATAC <- ATAC_counts %>%
  cpm(., log = TRUE) %>%
   as.data.frame() %>%
  rename_with(.,~gsub(pattern = "Ind1_75", replacement = "1_",.)) %>%
  rename_with(.,~gsub(pattern = "Ind2_87", replacement = "2_",.)) %>%
  rename_with(.,~gsub(pattern = "Ind3_77", replacement = "3_",.)) %>%
  rename_with(.,~gsub(pattern = "Ind6_71", replacement = "6_",.)) %>%
  rename_with(.,~gsub( "DX" ,'DOX',.)) %>%
  rename_with(.,~gsub( "DA" ,'DNR',.)) %>%
  rename_with(.,~gsub( "E" ,'EPI',.)) %>%
  rename_with(.,~gsub( "T" ,'TRZ',.)) %>%
  rename_with(.,~gsub( "M" ,'MTX',.)) %>%
  rename_with(.,~gsub( "V" ,'VEH',.)) %>%
  rename_with(.,~gsub("24h","_24h",.)) %>%
  rename_with(.,~gsub("3h","_3h",.))

plotpanelATAC %>%
  dplyr::filter(row.names(.) %in% PRDX6_peak$peak) %>%
  mutate(Peakid = row.names(.)) %>%
  pivot_longer(cols = !Peakid, names_to = "sample", values_to = "counts") %>%
  separate("sample", into = c("ind","trt","time")) %>%
  mutate(time=factor(time, levels = c("3h","24h"))) %>%
  mutate(trt=factor(trt, levels= c("DOX","EPI","DNR","MTX","TRZ","VEH"))) %>%
   ggplot(., aes (x = time, y=counts))+
  geom_boxplot(aes(fill=trt))+
  ggtitle(paste(PRDX6_peak$RNA," gene and \n",PRDX6_peak$peak," ATAC accessibility"))+
  scale_fill_manual(values = drug_pal)+
  theme_bw()+
  ylab("log2 cpm ATAC")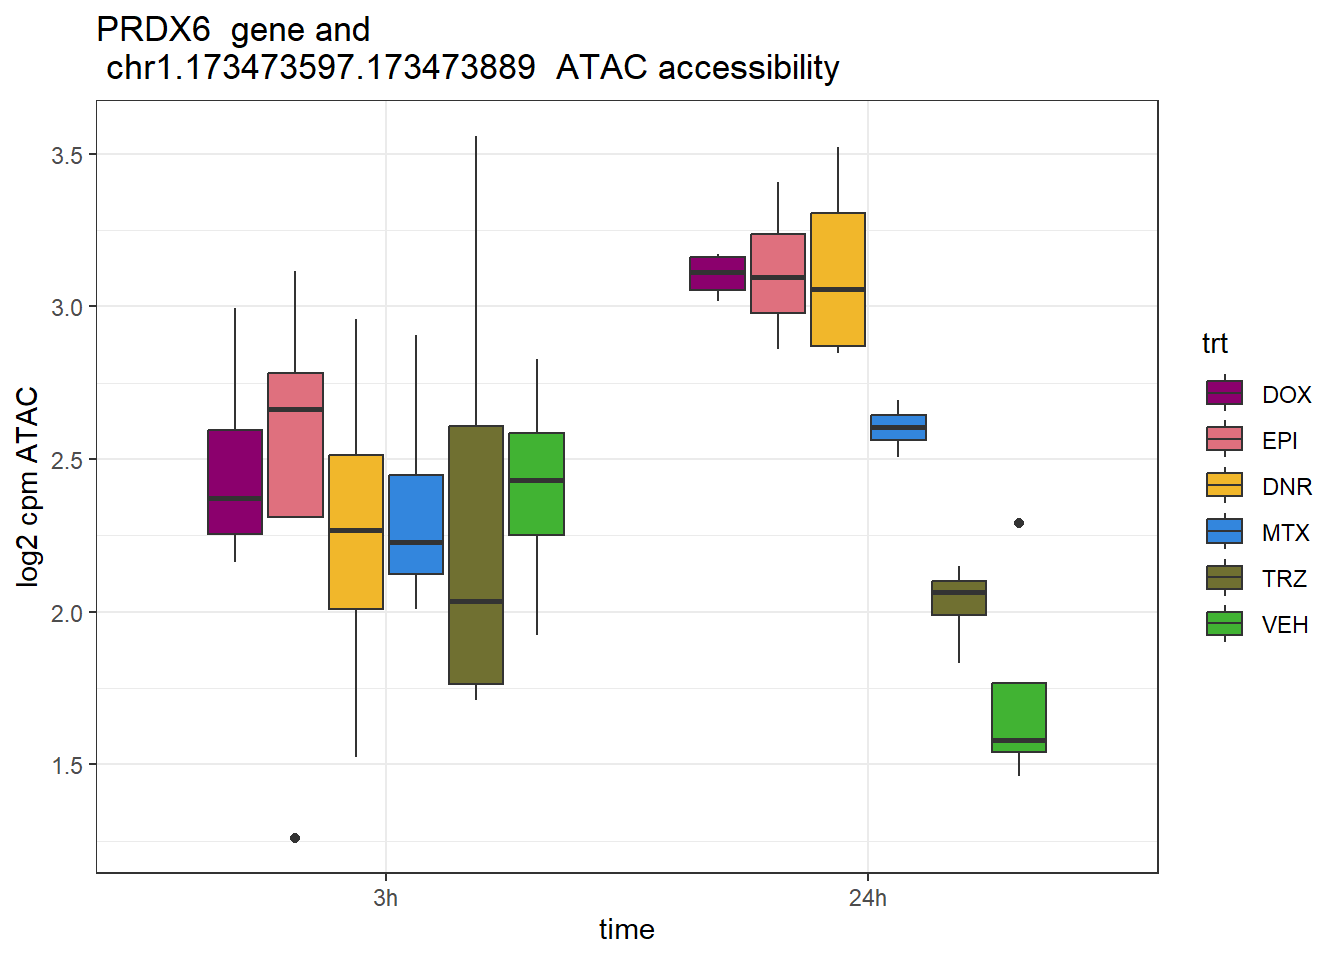
MSANTD2-AS1 rs7111513
schneider_df %>% dplyr::filter(RSID=="rs7111513")# A tibble: 1 × 14
# Groups: Peakid [1]
Peakid name RSID med_3h_lfc med_24h_lfc RNA_3h_lfc RNA_24h_lfc repClass
<chr> <chr> <chr> <dbl> <dbl> <dbl> <dbl> <chr>
1 chr11.1248… rs71… rs71… 0.162 0.574 0.904 2.48 NA
# ℹ 6 more variables: TEstatus <chr>, SYMBOL.x <chr>, reheat <chr>, mrc <chr>,
# point_ol <chr>, eQTL <chr>MSANTD2_AS1_peak <- data.frame(peak="chr11.124863016.124863456",RNA="MSANTD2-AS1", ENTREZID=100507283)
RNA_counts %>%
column_to_rownames("ENTREZID") %>%
cpm(., log = TRUE) %>%
as.data.frame() %>%
dplyr::filter(row.names(.) %in% MSANTD2_AS1_peak$ENTREZID) %>%
mutate(ENTREZID = row.names(.)) %>%
pivot_longer(cols = !ENTREZID, names_to = "sample", values_to = "counts") %>%
separate("sample", into = c("trt","ind","time")) %>%
mutate(time=factor(time, levels = c("3h","24h"))) %>%
mutate(trt=factor(trt, levels= c("DOX","EPI","DNR","MTX","TRZ","VEH"))) %>%
ggplot(., aes (x = time, y=counts))+
geom_boxplot(aes(fill=trt))+
ggtitle(paste(MSANTD2_AS1_peak$RNA," RNA expression"))+
scale_fill_manual(values = drug_pal)+
theme_bw()+
ylab("log2 cpm RNA")
| Version | Author | Date |
|---|---|---|
| c959920 | reneeisnowhere | 2024-10-28 |
plotpanelATAC <- ATAC_counts %>%
  cpm(., log = TRUE) %>%
   as.data.frame() %>%
  rename_with(.,~gsub(pattern = "Ind1_75", replacement = "1_",.)) %>%
  rename_with(.,~gsub(pattern = "Ind2_87", replacement = "2_",.)) %>%
  rename_with(.,~gsub(pattern = "Ind3_77", replacement = "3_",.)) %>%
  rename_with(.,~gsub(pattern = "Ind6_71", replacement = "6_",.)) %>%
  rename_with(.,~gsub( "DX" ,'DOX',.)) %>%
  rename_with(.,~gsub( "DA" ,'DNR',.)) %>%
  rename_with(.,~gsub( "E" ,'EPI',.)) %>%
  rename_with(.,~gsub( "T" ,'TRZ',.)) %>%
  rename_with(.,~gsub( "M" ,'MTX',.)) %>%
  rename_with(.,~gsub( "V" ,'VEH',.)) %>%
  rename_with(.,~gsub("24h","_24h",.)) %>%
  rename_with(.,~gsub("3h","_3h",.))

plotpanelATAC %>%
  dplyr::filter(row.names(.) %in% MSANTD2_AS1_peak$peak) %>%
  mutate(Peakid = row.names(.)) %>%
  pivot_longer(cols = !Peakid, names_to = "sample", values_to = "counts") %>%
  separate("sample", into = c("ind","trt","time")) %>%
  mutate(time=factor(time, levels = c("3h","24h"))) %>%
  mutate(trt=factor(trt, levels= c("DOX","EPI","DNR","MTX","TRZ","VEH"))) %>%
   ggplot(., aes (x = time, y=counts))+
  geom_boxplot(aes(fill=trt))+
  ggtitle(paste(MSANTD2_AS1_peak$RNA," gene and \n",MSANTD2_AS1_peak$peak," ATAC accessibility"))+
  scale_fill_manual(values = drug_pal)+
  theme_bw()+
  ylab("log2 cpm ATAC")
| Version | Author | Date |
|---|---|---|
| c959920 | reneeisnowhere | 2024-10-28 |
MSANTD2-AS1 rs7111513
schneider_df %>% dplyr::filter(RSID=="rs5017048")# A tibble: 1 × 14
# Groups: Peakid [1]
Peakid name RSID med_3h_lfc med_24h_lfc RNA_3h_lfc RNA_24h_lfc repClass
<chr> <chr> <chr> <dbl> <dbl> <dbl> <dbl> <chr>
1 chr11.1248… rs50… rs50… 0.162 0.574 0.904 2.48 NA
# ℹ 6 more variables: TEstatus <chr>, SYMBOL.x <chr>, reheat <chr>, mrc <chr>,
# point_ol <chr>, eQTL <chr>MSANTD2_AS1_peak <- data.frame(peak="chr11.124863016.124863456", RNA="MSANTD2-AS1", ENTREZID=
100507283)
RNA_counts %>%
column_to_rownames("ENTREZID") %>%
cpm(., log = TRUE) %>%
as.data.frame() %>%
dplyr::filter(row.names(.) %in% MSANTD2_AS1_peak$ENTREZID) %>%
mutate(ENTREZID = row.names(.)) %>%
pivot_longer(cols = !ENTREZID, names_to = "sample", values_to = "counts") %>%
separate("sample", into = c("trt","ind","time")) %>%
mutate(time=factor(time, levels = c("3h","24h"))) %>%
mutate(trt=factor(trt, levels= c("DOX","EPI","DNR","MTX","TRZ","VEH"))) %>%
ggplot(., aes (x = time, y=counts))+
geom_boxplot(aes(fill=trt))+
ggtitle(paste(MSANTD2_AS1_peak$RNA," RNA expression"))+
scale_fill_manual(values = drug_pal)+
theme_bw()+
ylab("log2 cpm RNA")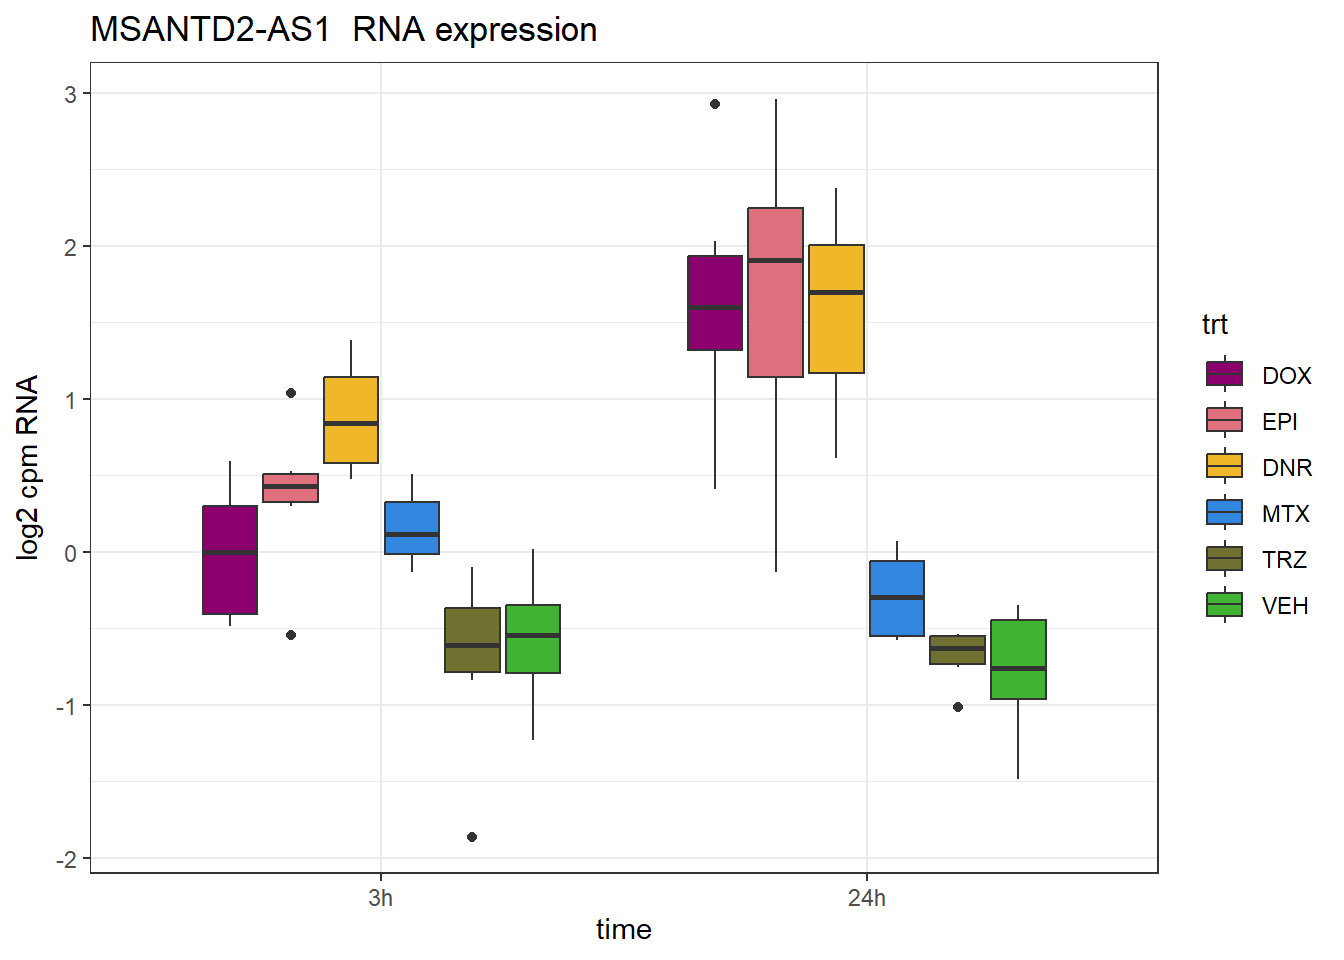
| Version | Author | Date |
|---|---|---|
| c959920 | reneeisnowhere | 2024-10-28 |
plotpanelATAC <- ATAC_counts %>%
  cpm(., log = TRUE) %>%
   as.data.frame() %>%
  rename_with(.,~gsub(pattern = "Ind1_75", replacement = "1_",.)) %>%
  rename_with(.,~gsub(pattern = "Ind2_87", replacement = "2_",.)) %>%
  rename_with(.,~gsub(pattern = "Ind3_77", replacement = "3_",.)) %>%
  rename_with(.,~gsub(pattern = "Ind6_71", replacement = "6_",.)) %>%
  rename_with(.,~gsub( "DX" ,'DOX',.)) %>%
  rename_with(.,~gsub( "DA" ,'DNR',.)) %>%
  rename_with(.,~gsub( "E" ,'EPI',.)) %>%
  rename_with(.,~gsub( "T" ,'TRZ',.)) %>%
  rename_with(.,~gsub( "M" ,'MTX',.)) %>%
  rename_with(.,~gsub( "V" ,'VEH',.)) %>%
  rename_with(.,~gsub("24h","_24h",.)) %>%
  rename_with(.,~gsub("3h","_3h",.))

plotpanelATAC %>%
  dplyr::filter(row.names(.) %in% MSANTD2_AS1_peak$peak) %>%
  mutate(Peakid = row.names(.)) %>%
  pivot_longer(cols = !Peakid, names_to = "sample", values_to = "counts") %>%
  separate("sample", into = c("ind","trt","time")) %>%
  mutate(time=factor(time, levels = c("3h","24h"))) %>%
  mutate(trt=factor(trt, levels= c("DOX","EPI","DNR","MTX","TRZ","VEH"))) %>%
   ggplot(., aes (x = time, y=counts))+
  geom_boxplot(aes(fill=trt))+
  ggtitle(paste(MSANTD2_AS1_peak$RNA," gene and \n",MSANTD2_AS1_peak$peak," ATAC accessibility"))+
  scale_fill_manual(values = drug_pal)+
  theme_bw()+
  ylab("log2 cpm ATAC")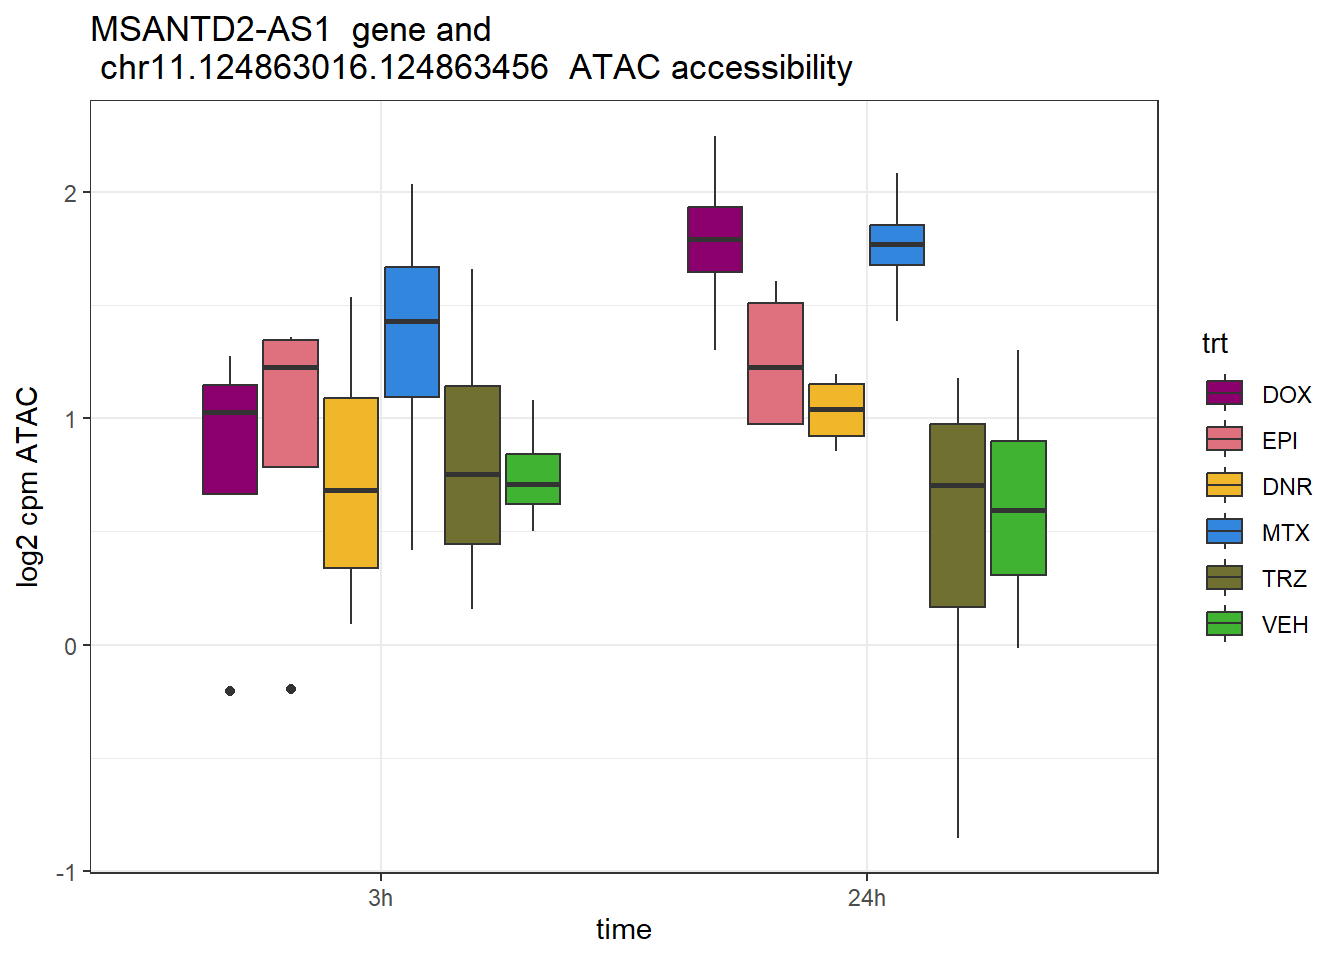
| Version | Author | Date |
|---|---|---|
| c959920 | reneeisnowhere | 2024-10-28 |
SLC8A1 rs6746423
schneider_df %>% dplyr::filter(RSID=="rs6746423")# A tibble: 1 × 14
# Groups: Peakid [1]
Peakid name RSID med_3h_lfc med_24h_lfc RNA_3h_lfc RNA_24h_lfc repClass
<chr> <chr> <chr> <dbl> <dbl> <dbl> <dbl> <chr>
1 chr2.41038… rs67… rs67… 0.0766 1.64 -0.0446 -2.96 SINE
# ℹ 6 more variables: TEstatus <chr>, SYMBOL.x <chr>, reheat <chr>, mrc <chr>,
# point_ol <chr>, eQTL <chr>SLC8A1_peak <- data.frame(peak="chr2.41038390.41038934", RNA="SLC8A1", ENTREZID=6546)
RNA_counts %>%
column_to_rownames("ENTREZID") %>%
cpm(., log = TRUE) %>%
as.data.frame() %>%
dplyr::filter(row.names(.) %in% SLC8A1_peak$ENTREZID) %>%
mutate(ENTREZID = row.names(.)) %>%
pivot_longer(cols = !ENTREZID, names_to = "sample", values_to = "counts") %>%
separate("sample", into = c("trt","ind","time")) %>%
mutate(time=factor(time, levels = c("3h","24h"))) %>%
mutate(trt=factor(trt, levels= c("DOX","EPI","DNR","MTX","TRZ","VEH"))) %>%
ggplot(., aes (x = time, y=counts))+
geom_boxplot(aes(fill=trt))+
ggtitle(paste(SLC8A1_peak$RNA," RNA expression"))+
scale_fill_manual(values = drug_pal)+
theme_bw()+
ylab("log2 cpm RNA")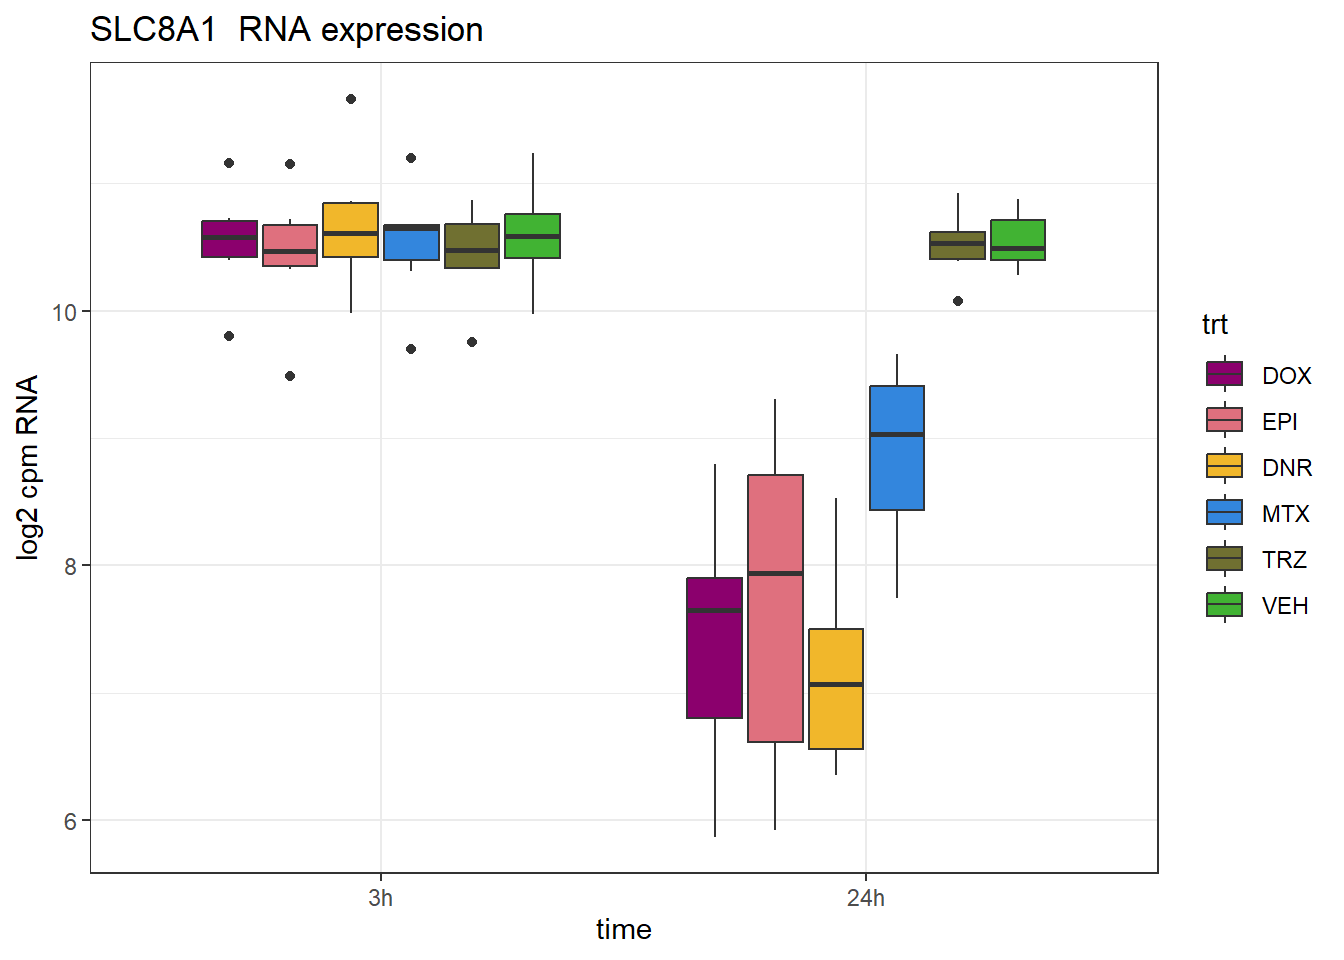
| Version | Author | Date |
|---|---|---|
| c959920 | reneeisnowhere | 2024-10-28 |
plotpanelATAC <- ATAC_counts %>%
  cpm(., log = TRUE) %>%
   as.data.frame() %>%
  rename_with(.,~gsub(pattern = "Ind1_75", replacement = "1_",.)) %>%
  rename_with(.,~gsub(pattern = "Ind2_87", replacement = "2_",.)) %>%
  rename_with(.,~gsub(pattern = "Ind3_77", replacement = "3_",.)) %>%
  rename_with(.,~gsub(pattern = "Ind6_71", replacement = "6_",.)) %>%
  rename_with(.,~gsub( "DX" ,'DOX',.)) %>%
  rename_with(.,~gsub( "DA" ,'DNR',.)) %>%
  rename_with(.,~gsub( "E" ,'EPI',.)) %>%
  rename_with(.,~gsub( "T" ,'TRZ',.)) %>%
  rename_with(.,~gsub( "M" ,'MTX',.)) %>%
  rename_with(.,~gsub( "V" ,'VEH',.)) %>%
  rename_with(.,~gsub("24h","_24h",.)) %>%
  rename_with(.,~gsub("3h","_3h",.))

plotpanelATAC %>%
  dplyr::filter(row.names(.) %in% SLC8A1_peak$peak) %>%
  mutate(Peakid = row.names(.)) %>%
  pivot_longer(cols = !Peakid, names_to = "sample", values_to = "counts") %>%
  separate("sample", into = c("ind","trt","time")) %>%
  mutate(time=factor(time, levels = c("3h","24h"))) %>%
  mutate(trt=factor(trt, levels= c("DOX","EPI","DNR","MTX","TRZ","VEH"))) %>%
   ggplot(., aes (x = time, y=counts))+
  geom_boxplot(aes(fill=trt))+
  ggtitle(paste(SLC8A1_peak$RNA," gene and \n",SLC8A1_peak$peak," ATAC accessibility"))+
  scale_fill_manual(values = drug_pal)+
  theme_bw()+
  ylab("log2 cpm ATAC")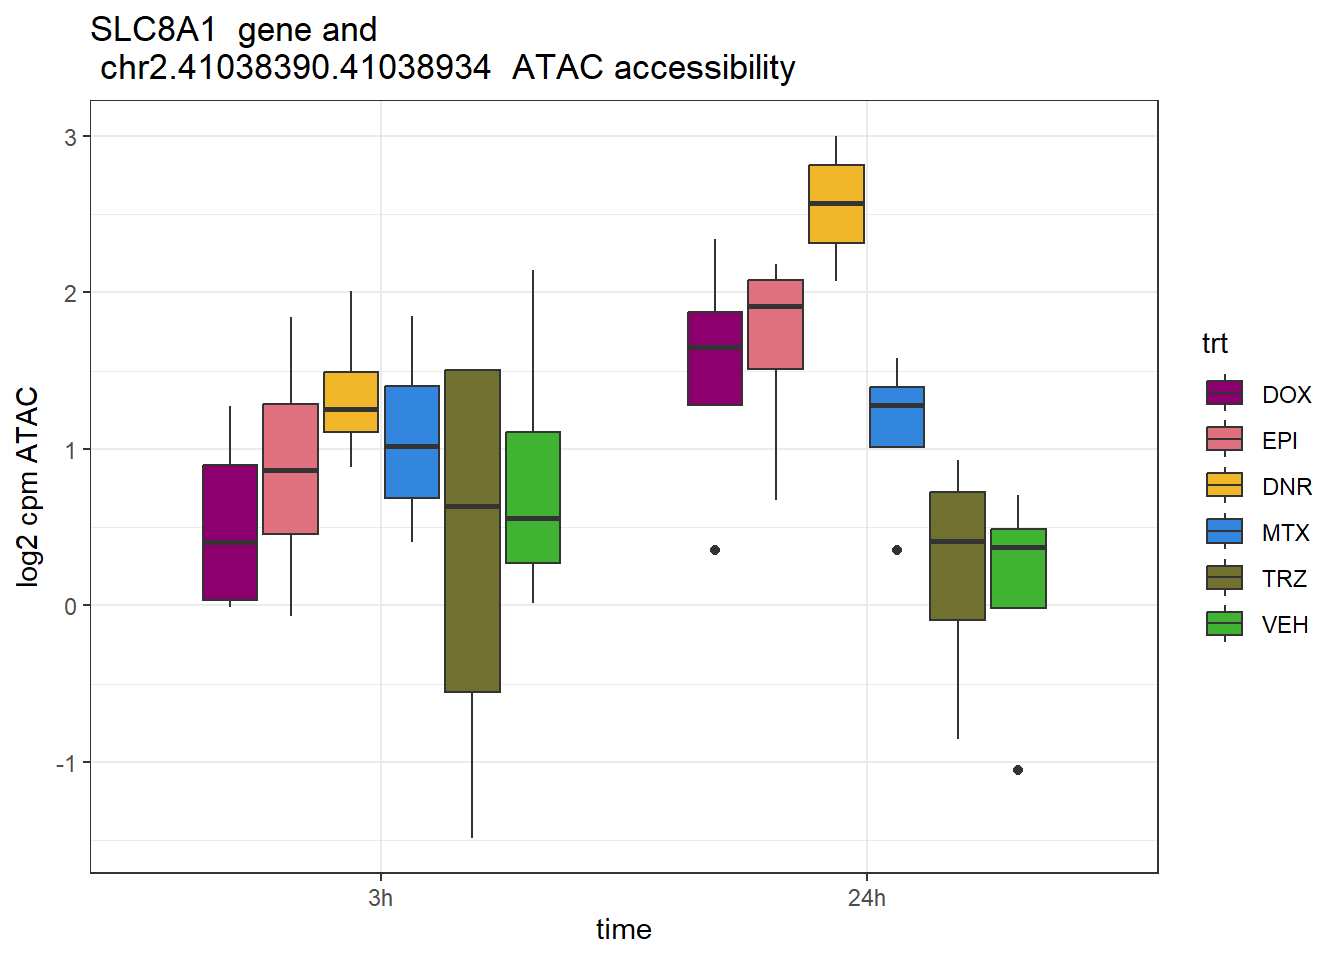
| Version | Author | Date |
|---|---|---|
| c959920 | reneeisnowhere | 2024-10-28 |
CDPF1 rs4253763; rs11090819
schneider_df %>% dplyr::filter(RSID=="rs4253763")# A tibble: 1 × 14
# Groups: Peakid [1]
Peakid name RSID med_3h_lfc med_24h_lfc RNA_3h_lfc RNA_24h_lfc repClass
<chr> <chr> <chr> <dbl> <dbl> <dbl> <dbl> <chr>
1 chr22.4622… rs42… rs42… 0.837 1.31 -0.251 -0.900 Other
# ℹ 6 more variables: TEstatus <chr>, SYMBOL.x <chr>, reheat <chr>, mrc <chr>,
# point_ol <chr>, eQTL <chr>CDPF1_peak <- data.frame(peak="chr22.46225398.46226192", RNA="CDPF1", ENTREZID=
150383)
RNA_counts %>%
column_to_rownames("ENTREZID") %>%
cpm(., log = TRUE) %>%
as.data.frame() %>%
dplyr::filter(row.names(.) %in% CDPF1_peak$ENTREZID) %>%
mutate(ENTREZID = row.names(.)) %>%
pivot_longer(cols = !ENTREZID, names_to = "sample", values_to = "counts") %>%
separate("sample", into = c("trt","ind","time")) %>%
mutate(time=factor(time, levels = c("3h","24h"))) %>%
mutate(trt=factor(trt, levels= c("DOX","EPI","DNR","MTX","TRZ","VEH"))) %>%
ggplot(., aes (x = time, y=counts))+
geom_boxplot(aes(fill=trt))+
ggtitle(paste(CDPF1_peak$RNA," RNA expression"))+
scale_fill_manual(values = drug_pal)+
theme_bw()+
ylab("log2 cpm RNA")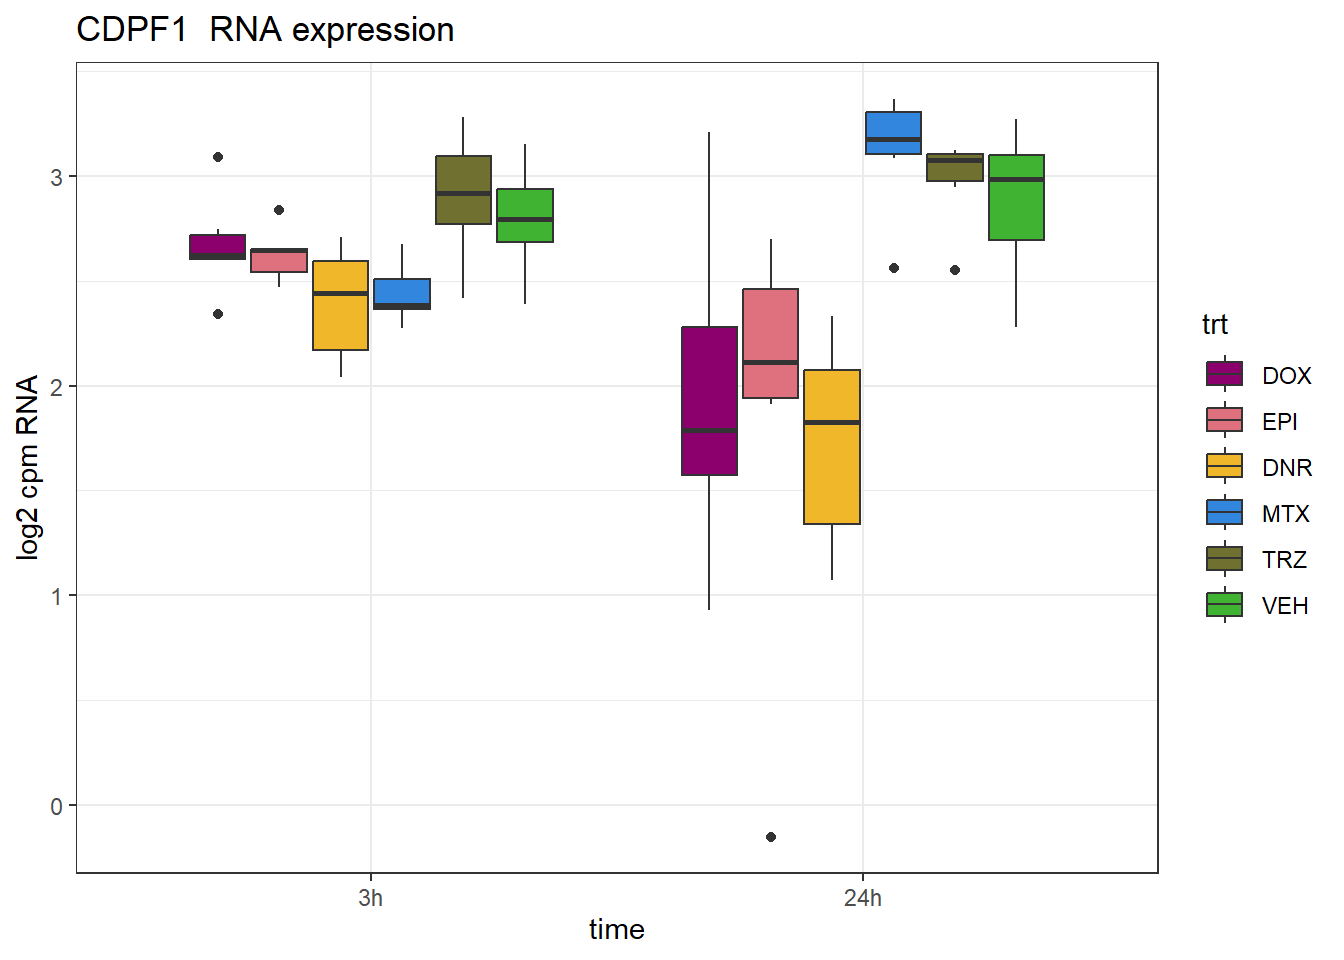
| Version | Author | Date |
|---|---|---|
| c959920 | reneeisnowhere | 2024-10-28 |
plotpanelATAC <- ATAC_counts %>%
  cpm(., log = TRUE) %>%
   as.data.frame() %>%
  rename_with(.,~gsub(pattern = "Ind1_75", replacement = "1_",.)) %>%
  rename_with(.,~gsub(pattern = "Ind2_87", replacement = "2_",.)) %>%
  rename_with(.,~gsub(pattern = "Ind3_77", replacement = "3_",.)) %>%
  rename_with(.,~gsub(pattern = "Ind6_71", replacement = "6_",.)) %>%
  rename_with(.,~gsub( "DX" ,'DOX',.)) %>%
  rename_with(.,~gsub( "DA" ,'DNR',.)) %>%
  rename_with(.,~gsub( "E" ,'EPI',.)) %>%
  rename_with(.,~gsub( "T" ,'TRZ',.)) %>%
  rename_with(.,~gsub( "M" ,'MTX',.)) %>%
  rename_with(.,~gsub( "V" ,'VEH',.)) %>%
  rename_with(.,~gsub("24h","_24h",.)) %>%
  rename_with(.,~gsub("3h","_3h",.))

plotpanelATAC %>%
  dplyr::filter(row.names(.) %in% CDPF1_peak$peak) %>%
  mutate(Peakid = row.names(.)) %>%
  pivot_longer(cols = !Peakid, names_to = "sample", values_to = "counts") %>%
  separate("sample", into = c("ind","trt","time")) %>%
  mutate(time=factor(time, levels = c("3h","24h"))) %>%
  mutate(trt=factor(trt, levels= c("DOX","EPI","DNR","MTX","TRZ","VEH"))) %>%
   ggplot(., aes (x = time, y=counts))+
  geom_boxplot(aes(fill=trt))+
  ggtitle(paste(CDPF1_peak$RNA," gene and \n",CDPF1_peak$peak," ATAC accessibility"))+
  scale_fill_manual(values = drug_pal)+
  theme_bw()+
  ylab("log2 cpm ATAC")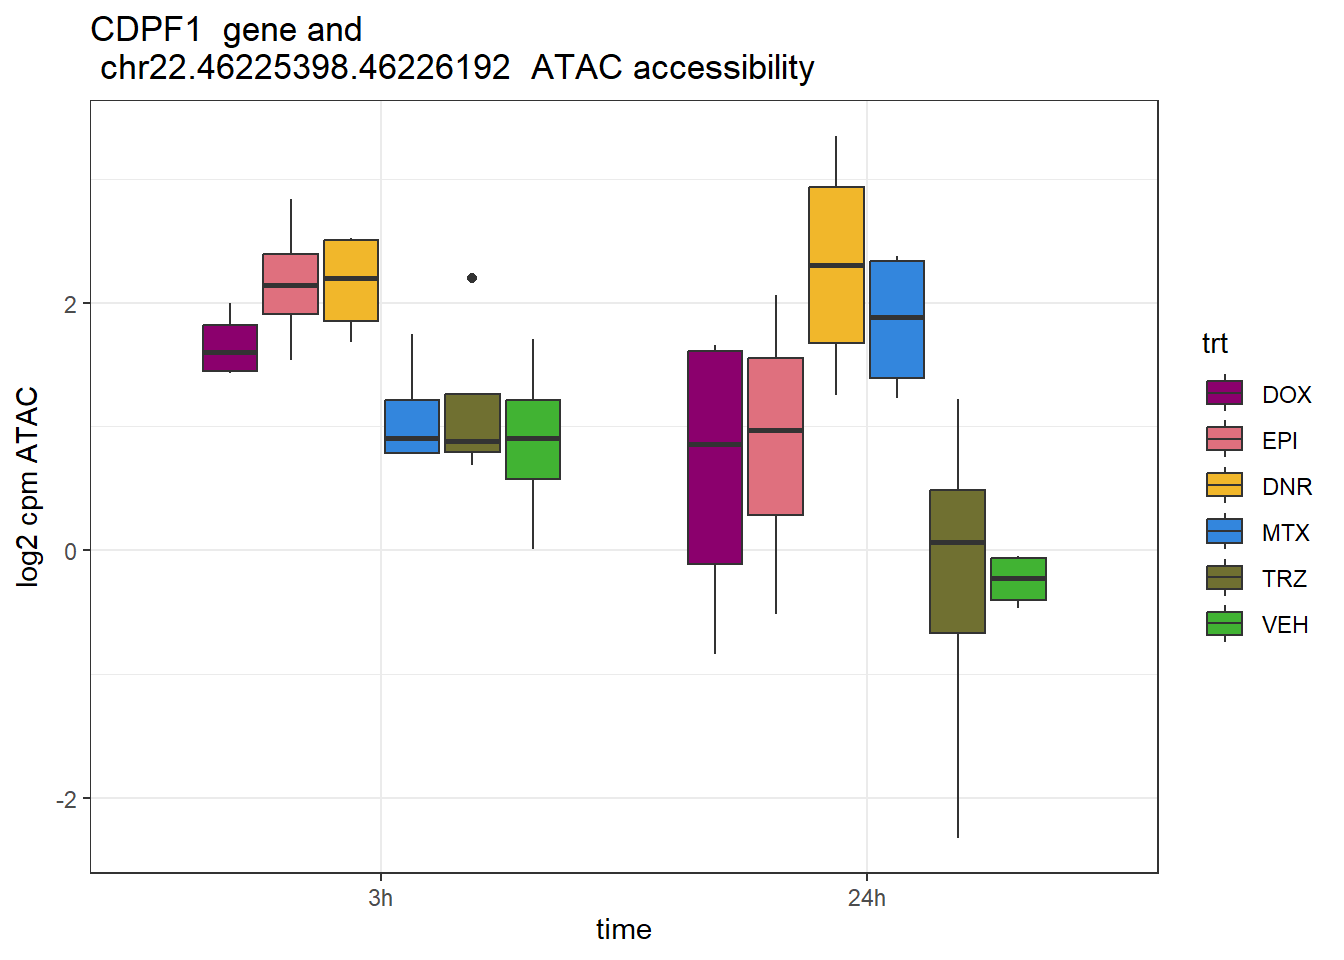
| Version | Author | Date |
|---|---|---|
| c959920 | reneeisnowhere | 2024-10-28 |
GIN1 rs6860588; rs3776874; rs11952361
schneider_df %>% dplyr::filter(RSID=="rs11952361")# A tibble: 1 × 14
# Groups: Peakid [1]
Peakid name RSID med_3h_lfc med_24h_lfc RNA_3h_lfc RNA_24h_lfc repClass
<chr> <chr> <chr> <dbl> <dbl> <dbl> <dbl> <chr>
1 chr5.10294… rs11… rs11… -0.645 -1.27 -0.598 -0.506 LTR
# ℹ 6 more variables: TEstatus <chr>, SYMBOL.x <chr>, reheat <chr>, mrc <chr>,
# point_ol <chr>, eQTL <chr>GIN1_peak <- data.frame(peak="chr5.102947036.102947471", RNA="GIN1", ENTREZID= 54826)
RNA_counts %>%
column_to_rownames("ENTREZID") %>%
cpm(., log = TRUE) %>%
as.data.frame() %>%
dplyr::filter(row.names(.) %in% GIN1_peak$ENTREZID) %>%
mutate(ENTREZID = row.names(.)) %>%
pivot_longer(cols = !ENTREZID, names_to = "sample", values_to = "counts") %>%
separate("sample", into = c("trt","ind","time")) %>%
mutate(time=factor(time, levels = c("3h","24h"))) %>%
mutate(trt=factor(trt, levels= c("DOX","EPI","DNR","MTX","TRZ","VEH"))) %>%
ggplot(., aes (x = time, y=counts))+
geom_boxplot(aes(fill=trt))+
ggtitle(paste(GIN1_peak$RNA," RNA expression"))+
scale_fill_manual(values = drug_pal)+
theme_bw()+
ylab("log2 cpm RNA")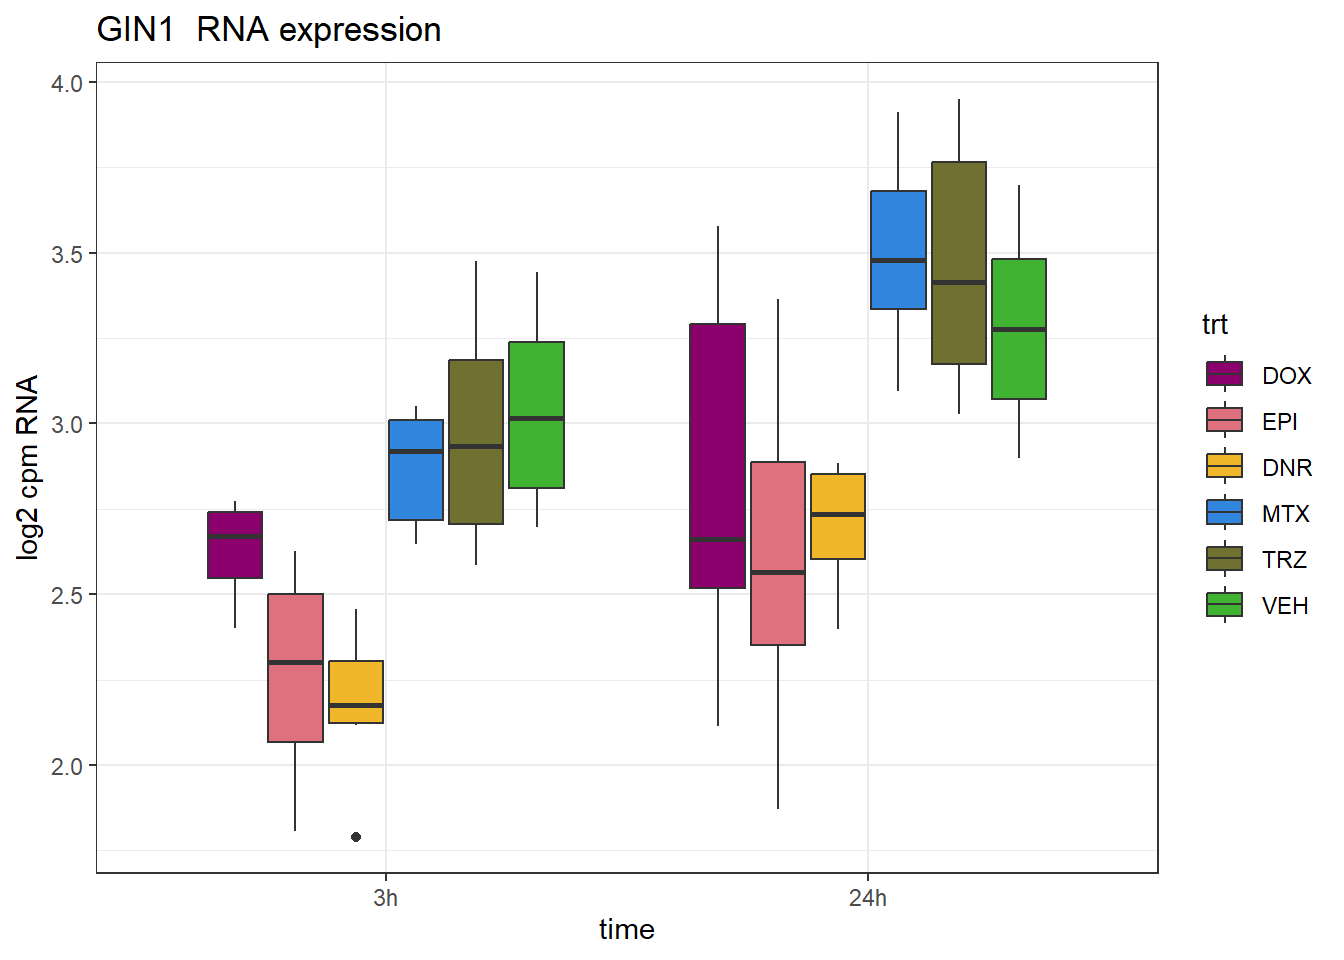
| Version | Author | Date |
|---|---|---|
| c959920 | reneeisnowhere | 2024-10-28 |
plotpanelATAC <- ATAC_counts %>%
  cpm(., log = TRUE) %>%
   as.data.frame() %>%
  rename_with(.,~gsub(pattern = "Ind1_75", replacement = "1_",.)) %>%
  rename_with(.,~gsub(pattern = "Ind2_87", replacement = "2_",.)) %>%
  rename_with(.,~gsub(pattern = "Ind3_77", replacement = "3_",.)) %>%
  rename_with(.,~gsub(pattern = "Ind6_71", replacement = "6_",.)) %>%
  rename_with(.,~gsub( "DX" ,'DOX',.)) %>%
  rename_with(.,~gsub( "DA" ,'DNR',.)) %>%
  rename_with(.,~gsub( "E" ,'EPI',.)) %>%
  rename_with(.,~gsub( "T" ,'TRZ',.)) %>%
  rename_with(.,~gsub( "M" ,'MTX',.)) %>%
  rename_with(.,~gsub( "V" ,'VEH',.)) %>%
  rename_with(.,~gsub("24h","_24h",.)) %>%
  rename_with(.,~gsub("3h","_3h",.))

plotpanelATAC %>%
  dplyr::filter(row.names(.) %in% GIN1_peak$peak) %>%
  mutate(Peakid = row.names(.)) %>%
  pivot_longer(cols = !Peakid, names_to = "sample", values_to = "counts") %>%
  separate("sample", into = c("ind","trt","time")) %>%
  mutate(time=factor(time, levels = c("3h","24h"))) %>%
  mutate(trt=factor(trt, levels= c("DOX","EPI","DNR","MTX","TRZ","VEH"))) %>%
   ggplot(., aes (x = time, y=counts))+
  geom_boxplot(aes(fill=trt))+
  ggtitle(paste(GIN1_peak$RNA," gene and \n",GIN1_peak$peak," ATAC accessibility"))+
  scale_fill_manual(values = drug_pal)+
  theme_bw()+
  ylab("log2 cpm ATAC")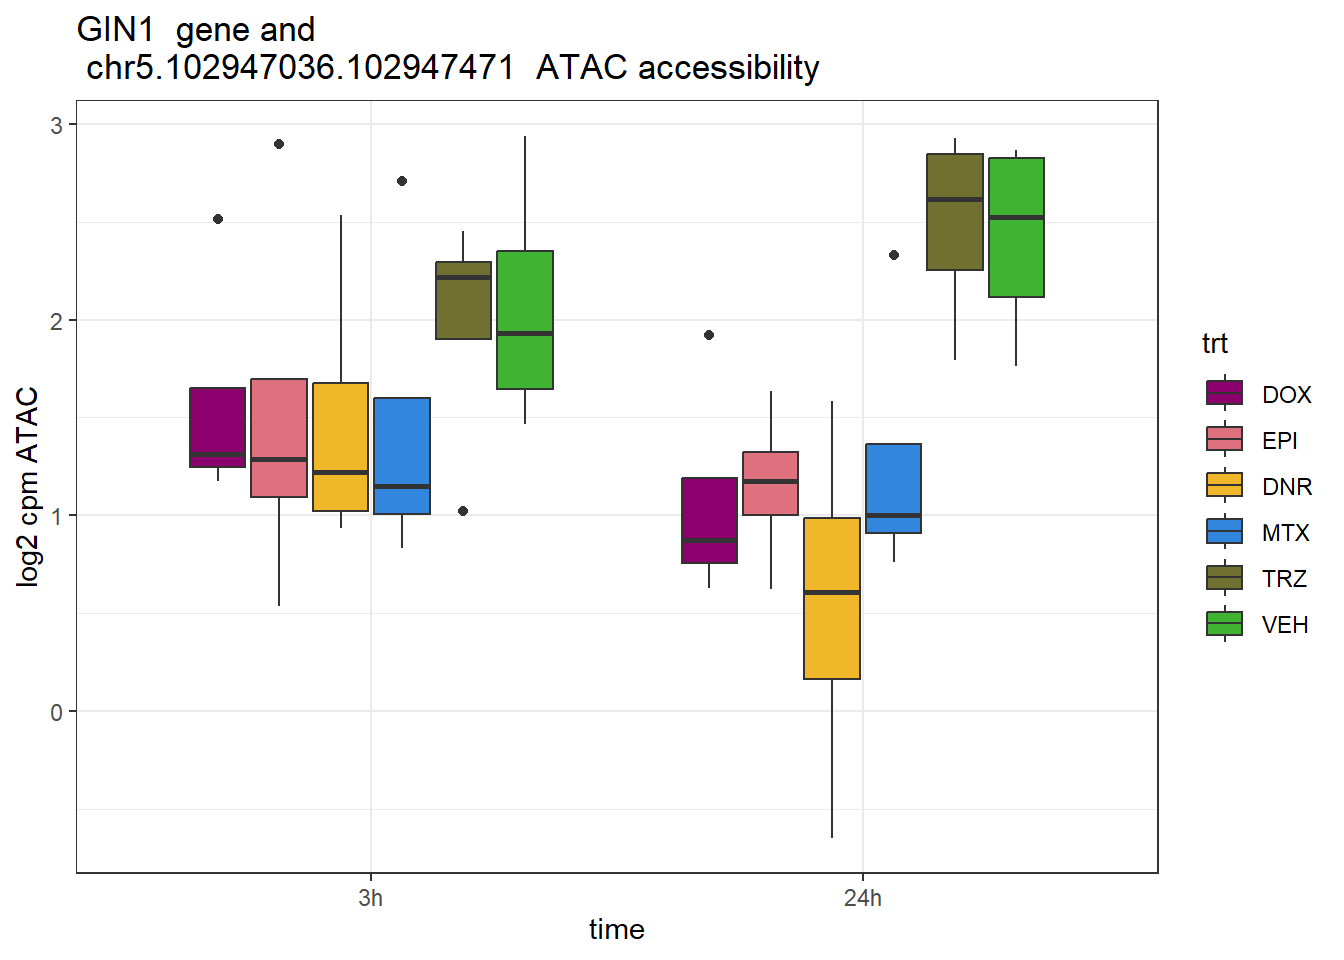
| Version | Author | Date |
|---|---|---|
| c959920 | reneeisnowhere | 2024-10-28 |
OGFRL1 rs1204328
schneider_df %>% dplyr::filter(RSID=="rs1204328")# A tibble: 1 × 14
# Groups: Peakid [1]
Peakid name RSID med_3h_lfc med_24h_lfc RNA_3h_lfc RNA_24h_lfc repClass
<chr> <chr> <chr> <dbl> <dbl> <dbl> <dbl> <chr>
1 chr6.71712… rs12… rs12… 0.224 -0.436 0.233 1.10 LTR
# ℹ 6 more variables: TEstatus <chr>, SYMBOL.x <chr>, reheat <chr>, mrc <chr>,
# point_ol <chr>, eQTL <chr>OGFRL1_peak <- data.frame(peak="chr6.71712533.71713167", RNA="OGFRL1", ENTREZID= 79627)
RNA_counts %>%
column_to_rownames("ENTREZID") %>%
cpm(., log = TRUE) %>%
as.data.frame() %>%
dplyr::filter(row.names(.) %in% OGFRL1_peak$ENTREZID) %>%
mutate(ENTREZID = row.names(.)) %>%
pivot_longer(cols = !ENTREZID, names_to = "sample", values_to = "counts") %>%
separate("sample", into = c("trt","ind","time")) %>%
mutate(time=factor(time, levels = c("3h","24h"))) %>%
mutate(trt=factor(trt, levels= c("DOX","EPI","DNR","MTX","TRZ","VEH"))) %>%
ggplot(., aes (x = time, y=counts))+
geom_boxplot(aes(fill=trt))+
ggtitle(paste(OGFRL1_peak$RNA," RNA expression"))+
scale_fill_manual(values = drug_pal)+
theme_bw()+
ylab("log2 cpm RNA")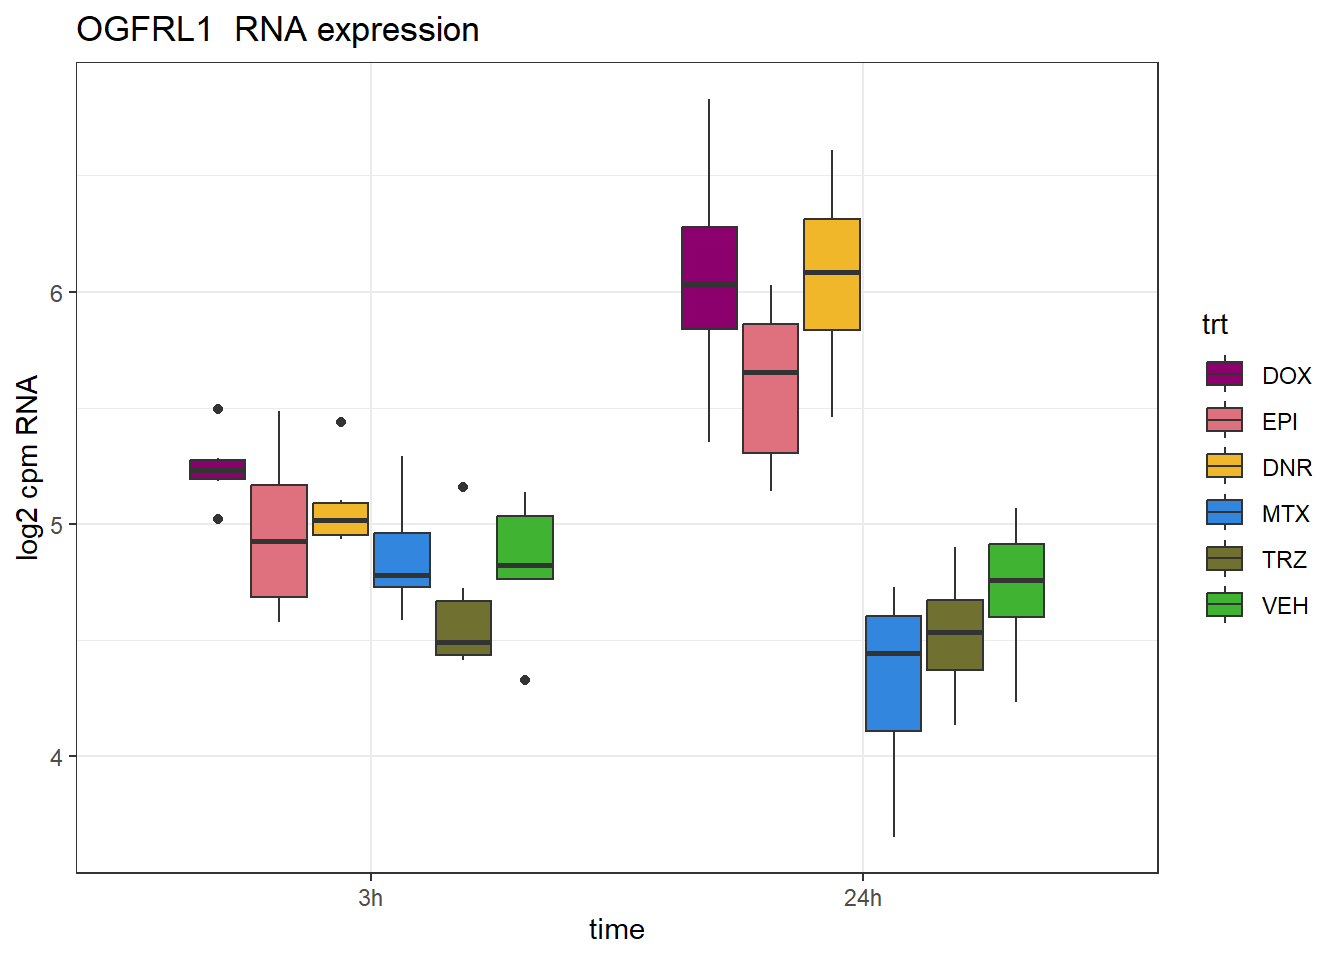
| Version | Author | Date |
|---|---|---|
| c959920 | reneeisnowhere | 2024-10-28 |
plotpanelATAC <- ATAC_counts %>%
  cpm(., log = TRUE) %>%
   as.data.frame() %>%
  rename_with(.,~gsub(pattern = "Ind1_75", replacement = "1_",.)) %>%
  rename_with(.,~gsub(pattern = "Ind2_87", replacement = "2_",.)) %>%
  rename_with(.,~gsub(pattern = "Ind3_77", replacement = "3_",.)) %>%
  rename_with(.,~gsub(pattern = "Ind6_71", replacement = "6_",.)) %>%
  rename_with(.,~gsub( "DX" ,'DOX',.)) %>%
  rename_with(.,~gsub( "DA" ,'DNR',.)) %>%
  rename_with(.,~gsub( "E" ,'EPI',.)) %>%
  rename_with(.,~gsub( "T" ,'TRZ',.)) %>%
  rename_with(.,~gsub( "M" ,'MTX',.)) %>%
  rename_with(.,~gsub( "V" ,'VEH',.)) %>%
  rename_with(.,~gsub("24h","_24h",.)) %>%
  rename_with(.,~gsub("3h","_3h",.))

plotpanelATAC %>%
  dplyr::filter(row.names(.) %in% OGFRL1_peak$peak) %>%
  mutate(Peakid = row.names(.)) %>%
  pivot_longer(cols = !Peakid, names_to = "sample", values_to = "counts") %>%
  separate("sample", into = c("ind","trt","time")) %>%
  mutate(time=factor(time, levels = c("3h","24h"))) %>%
  mutate(trt=factor(trt, levels= c("DOX","EPI","DNR","MTX","TRZ","VEH"))) %>%
   ggplot(., aes (x = time, y=counts))+
  geom_boxplot(aes(fill=trt))+
  ggtitle(paste(OGFRL1_peak$RNA," gene and \n",OGFRL1_peak$peak," ATAC accessibility"))+
  scale_fill_manual(values = drug_pal)+
  theme_bw()+
  ylab("log2 cpm ATAC")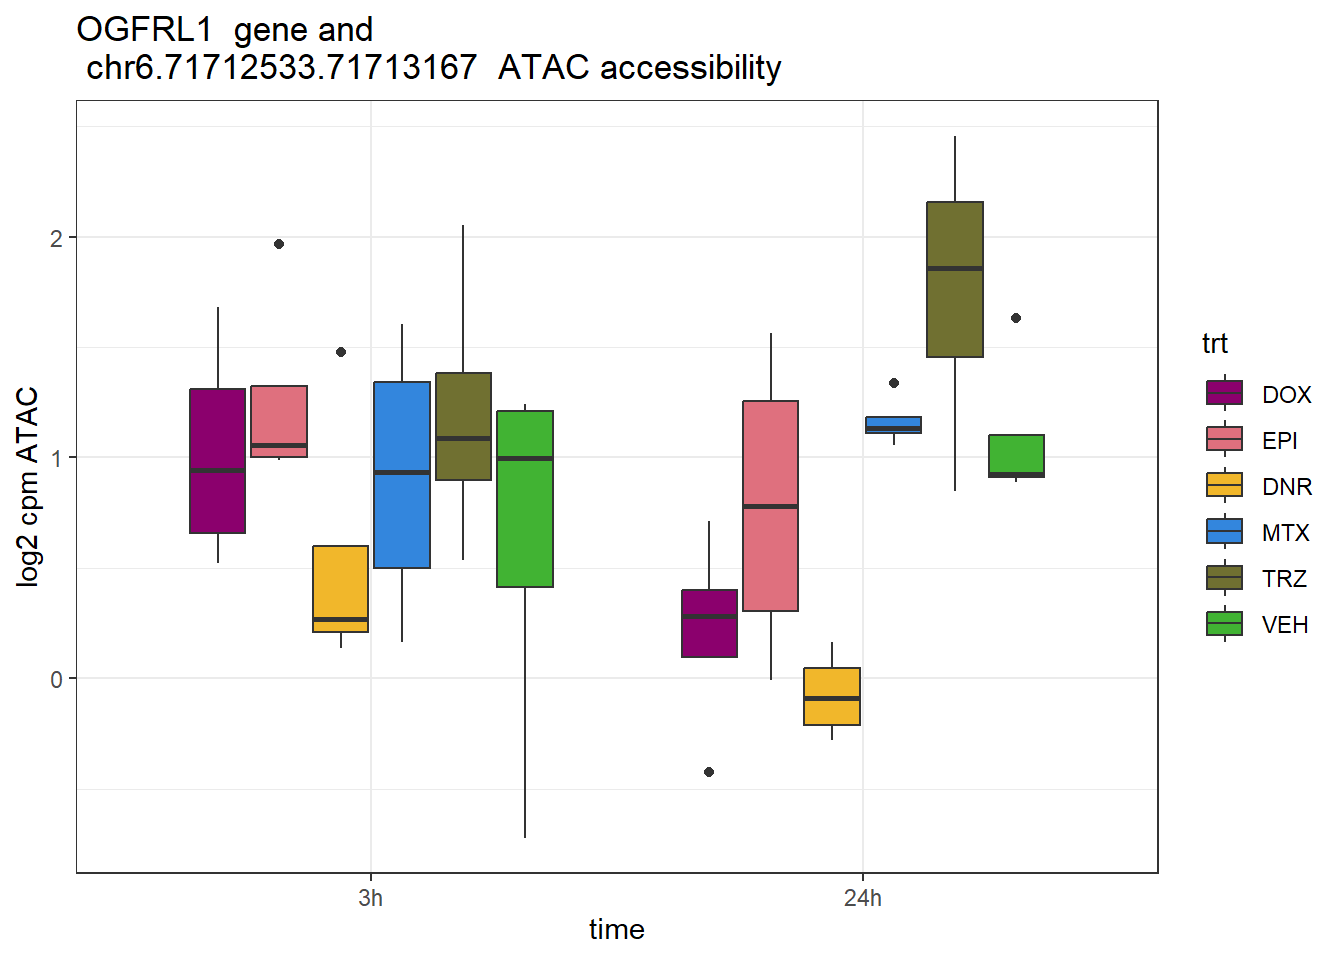
| Version | Author | Date |
|---|---|---|
| c959920 | reneeisnowhere | 2024-10-28 |
ATP6V1B2 rs12548222
schneider_df %>% dplyr::filter(RSID=="rs12548222")# A tibble: 1 × 14
# Groups: Peakid [1]
Peakid name RSID med_3h_lfc med_24h_lfc RNA_3h_lfc RNA_24h_lfc repClass
<chr> <chr> <chr> <dbl> <dbl> <dbl> <dbl> <chr>
1 chr8.20115… rs12… rs12… -0.679 0.828 0.0935 0.470 NA
# ℹ 6 more variables: TEstatus <chr>, SYMBOL.x <chr>, reheat <chr>, mrc <chr>,
# point_ol <chr>, eQTL <chr>ATP6V1B2_peak <- data.frame(peak="chr8.20115130.20115538", RNA="ATP6V1B2", ENTREZID= 526)
RNA_counts %>%
column_to_rownames("ENTREZID") %>%
cpm(., log = TRUE) %>%
as.data.frame() %>%
dplyr::filter(row.names(.) %in% ATP6V1B2_peak$ENTREZID) %>%
mutate(ENTREZID = row.names(.)) %>%
pivot_longer(cols = !ENTREZID, names_to = "sample", values_to = "counts") %>%
separate("sample", into = c("trt","ind","time")) %>%
mutate(time=factor(time, levels = c("3h","24h"))) %>%
mutate(trt=factor(trt, levels= c("DOX","EPI","DNR","MTX","TRZ","VEH"))) %>%
ggplot(., aes (x = time, y=counts))+
geom_boxplot(aes(fill=trt))+
ggtitle(paste(ATP6V1B2_peak$RNA," RNA expression"))+
scale_fill_manual(values = drug_pal)+
theme_bw()+
ylab("log2 cpm RNA")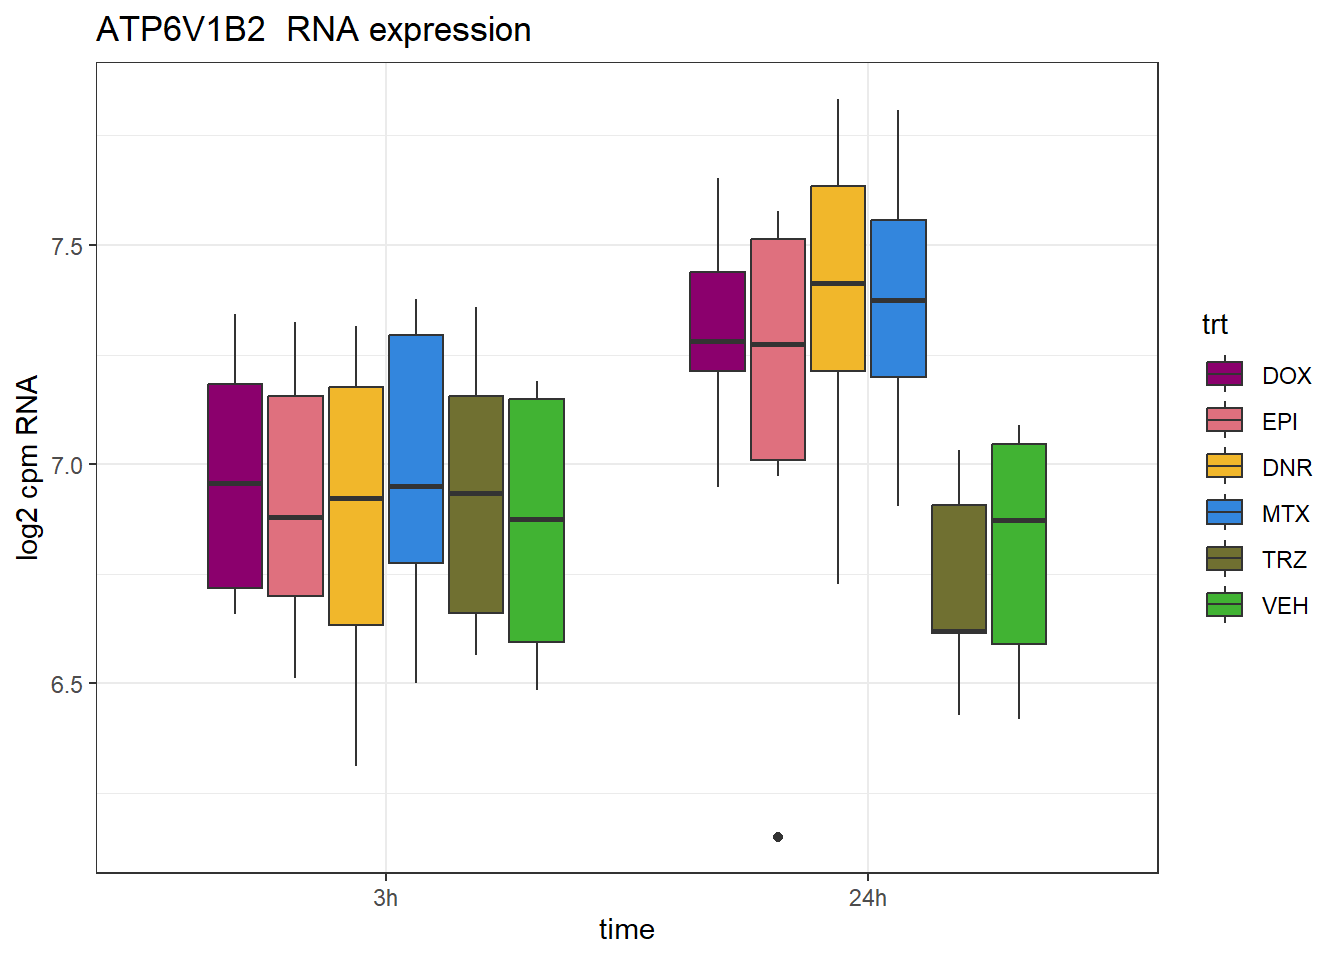
| Version | Author | Date |
|---|---|---|
| c959920 | reneeisnowhere | 2024-10-28 |
plotpanelATAC <- ATAC_counts %>%
  cpm(., log = TRUE) %>%
   as.data.frame() %>%
  rename_with(.,~gsub(pattern = "Ind1_75", replacement = "1_",.)) %>%
  rename_with(.,~gsub(pattern = "Ind2_87", replacement = "2_",.)) %>%
  rename_with(.,~gsub(pattern = "Ind3_77", replacement = "3_",.)) %>%
  rename_with(.,~gsub(pattern = "Ind6_71", replacement = "6_",.)) %>%
  rename_with(.,~gsub( "DX" ,'DOX',.)) %>%
  rename_with(.,~gsub( "DA" ,'DNR',.)) %>%
  rename_with(.,~gsub( "E" ,'EPI',.)) %>%
  rename_with(.,~gsub( "T" ,'TRZ',.)) %>%
  rename_with(.,~gsub( "M" ,'MTX',.)) %>%
  rename_with(.,~gsub( "V" ,'VEH',.)) %>%
  rename_with(.,~gsub("24h","_24h",.)) %>%
  rename_with(.,~gsub("3h","_3h",.))

plotpanelATAC %>%
  dplyr::filter(row.names(.) %in% ATP6V1B2_peak$peak) %>%
  mutate(Peakid = row.names(.)) %>%
  pivot_longer(cols = !Peakid, names_to = "sample", values_to = "counts") %>%
  separate("sample", into = c("ind","trt","time")) %>%
  mutate(time=factor(time, levels = c("3h","24h"))) %>%
  mutate(trt=factor(trt, levels= c("DOX","EPI","DNR","MTX","TRZ","VEH"))) %>%
   ggplot(., aes (x = time, y=counts))+
  geom_boxplot(aes(fill=trt))+
  ggtitle(paste(ATP6V1B2_peak$RNA," gene and \n",ATP6V1B2_peak$peak," ATAC accessibility"))+
  scale_fill_manual(values = drug_pal)+
  theme_bw()+
  ylab("log2 cpm ATAC")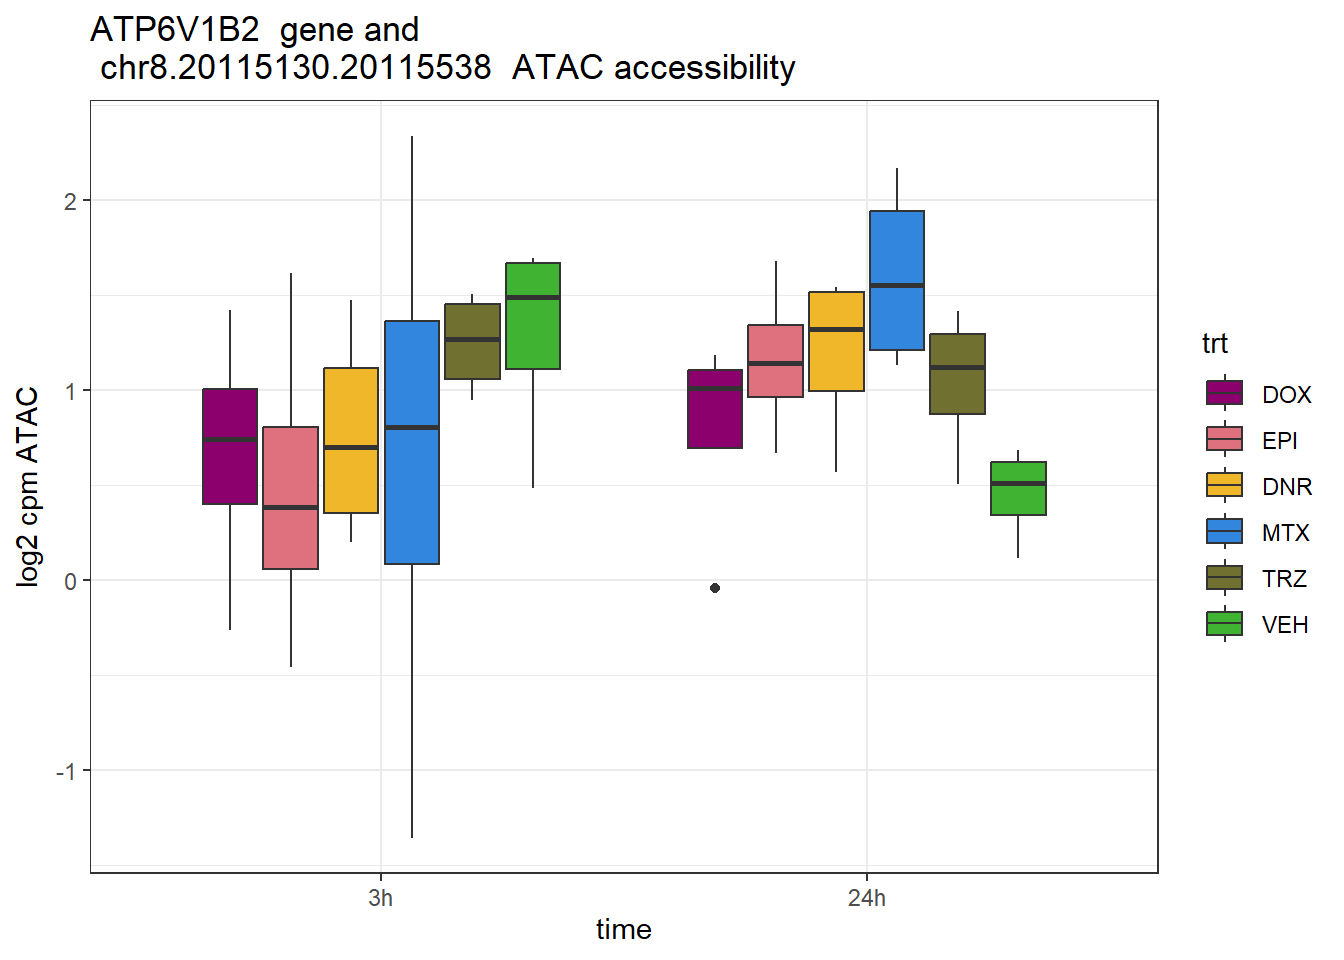
| Version | Author | Date |
|---|---|---|
| c959920 | reneeisnowhere | 2024-10-28 |
ARFGEF1 rs7820882;rs11779485
schneider_df %>% dplyr::filter(RSID=="rs7820882")# A tibble: 1 × 14
# Groups: Peakid [1]
Peakid name RSID med_3h_lfc med_24h_lfc RNA_3h_lfc RNA_24h_lfc repClass
<chr> <chr> <chr> <dbl> <dbl> <dbl> <dbl> <chr>
1 chr8.67481… rs78… rs78… -0.695 -0.744 -0.405 0.279 Other
# ℹ 6 more variables: TEstatus <chr>, SYMBOL.x <chr>, reheat <chr>, mrc <chr>,
# point_ol <chr>, eQTL <chr>ARFGEF1_peak <- data.frame(peak="chr8.67481465.67482210", RNA="ARFGEF1", ENTREZID= 10565)
RNA_counts %>%
column_to_rownames("ENTREZID") %>%
cpm(., log = TRUE) %>%
as.data.frame() %>%
dplyr::filter(row.names(.) %in% ARFGEF1_peak$ENTREZID) %>%
mutate(ENTREZID = row.names(.)) %>%
pivot_longer(cols = !ENTREZID, names_to = "sample", values_to = "counts") %>%
separate("sample", into = c("trt","ind","time")) %>%
mutate(time=factor(time, levels = c("3h","24h"))) %>%
mutate(trt=factor(trt, levels= c("DOX","EPI","DNR","MTX","TRZ","VEH"))) %>%
ggplot(., aes (x = time, y=counts))+
geom_boxplot(aes(fill=trt))+
ggtitle(paste(ARFGEF1_peak$RNA," RNA expression"))+
scale_fill_manual(values = drug_pal)+
theme_bw()+
ylab("log2 cpm RNA")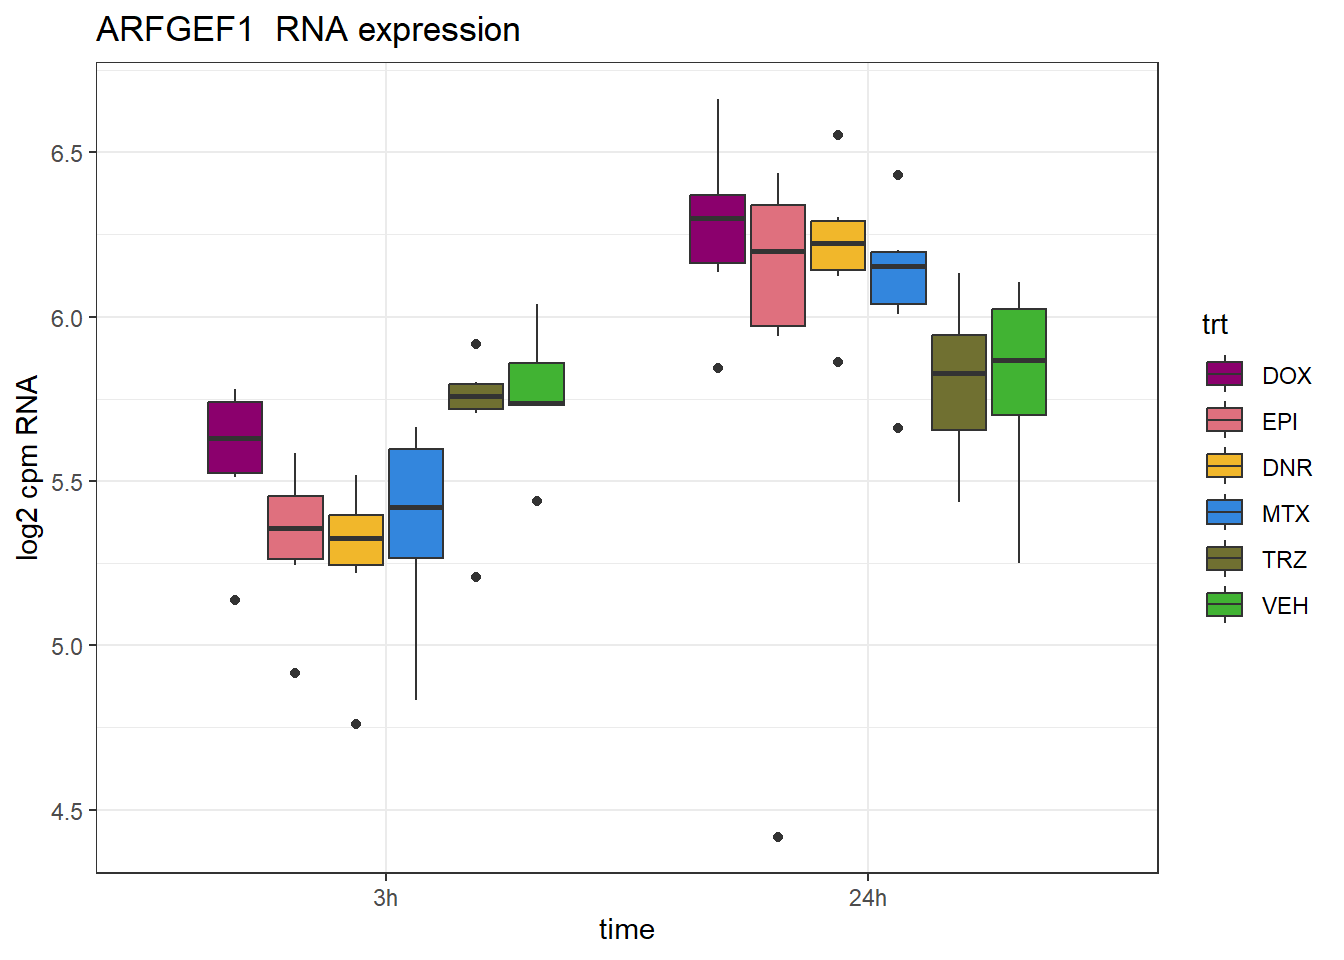
| Version | Author | Date |
|---|---|---|
| c959920 | reneeisnowhere | 2024-10-28 |
plotpanelATAC <- ATAC_counts %>%
  cpm(., log = TRUE) %>%
   as.data.frame() %>%
  rename_with(.,~gsub(pattern = "Ind1_75", replacement = "1_",.)) %>%
  rename_with(.,~gsub(pattern = "Ind2_87", replacement = "2_",.)) %>%
  rename_with(.,~gsub(pattern = "Ind3_77", replacement = "3_",.)) %>%
  rename_with(.,~gsub(pattern = "Ind6_71", replacement = "6_",.)) %>%
  rename_with(.,~gsub( "DX" ,'DOX',.)) %>%
  rename_with(.,~gsub( "DA" ,'DNR',.)) %>%
  rename_with(.,~gsub( "E" ,'EPI',.)) %>%
  rename_with(.,~gsub( "T" ,'TRZ',.)) %>%
  rename_with(.,~gsub( "M" ,'MTX',.)) %>%
  rename_with(.,~gsub( "V" ,'VEH',.)) %>%
  rename_with(.,~gsub("24h","_24h",.)) %>%
  rename_with(.,~gsub("3h","_3h",.))

plotpanelATAC %>%
  dplyr::filter(row.names(.) %in% ARFGEF1_peak$peak) %>%
  mutate(Peakid = row.names(.)) %>%
  pivot_longer(cols = !Peakid, names_to = "sample", values_to = "counts") %>%
  separate("sample", into = c("ind","trt","time")) %>%
  mutate(time=factor(time, levels = c("3h","24h"))) %>%
  mutate(trt=factor(trt, levels= c("DOX","EPI","DNR","MTX","TRZ","VEH"))) %>%
   ggplot(., aes (x = time, y=counts))+
  geom_boxplot(aes(fill=trt))+
  ggtitle(paste(ARFGEF1_peak$RNA," gene and \n",ARFGEF1_peak$peak," ATAC accessibility"))+
  scale_fill_manual(values = drug_pal)+
  theme_bw()+
  ylab("log2 cpm ATAC")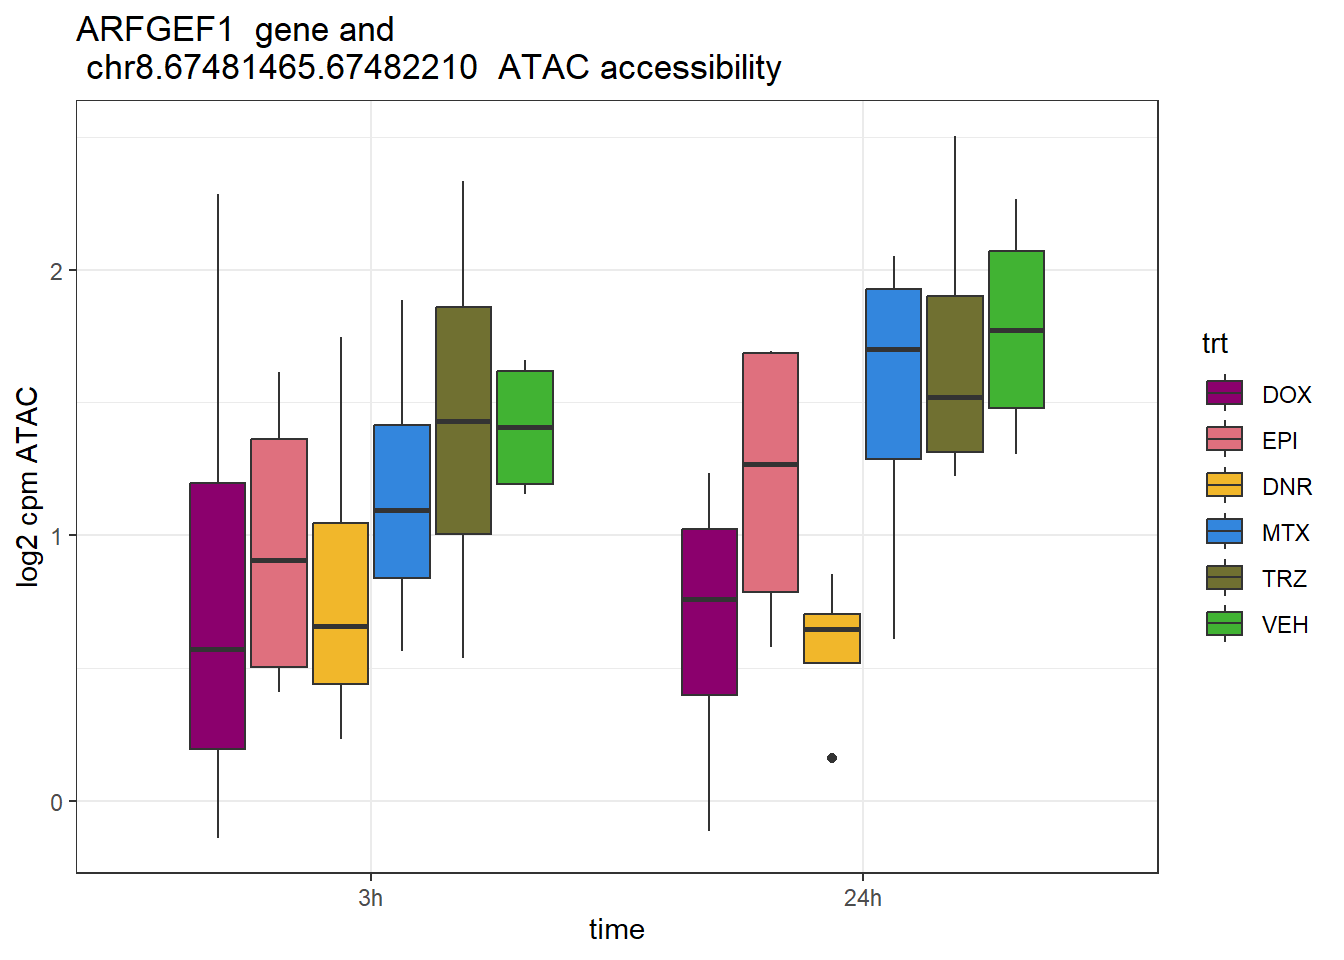
| Version | Author | Date |
|---|---|---|
| c959920 | reneeisnowhere | 2024-10-28 |
ARFGEF1 rs4737838
schneider_df %>% dplyr::filter(RSID=="rs4737838")# A tibble: 1 × 14
# Groups: Peakid [1]
Peakid name RSID med_3h_lfc med_24h_lfc RNA_3h_lfc RNA_24h_lfc repClass
<chr> <chr> <chr> <dbl> <dbl> <dbl> <dbl> <chr>
1 chr8.67503… rs47… rs47… -1.05 -0.827 -0.405 0.279 SINE
# ℹ 6 more variables: TEstatus <chr>, SYMBOL.x <chr>, reheat <chr>, mrc <chr>,
# point_ol <chr>, eQTL <chr>ARFGEF1_peak <- data.frame(peak="chr8.67503991.67504420", RNA="ARFGEF1", ENTREZID= 10565)
RNA_counts %>%
column_to_rownames("ENTREZID") %>%
cpm(., log = TRUE) %>%
as.data.frame() %>%
dplyr::filter(row.names(.) %in% ARFGEF1_peak$ENTREZID) %>%
mutate(ENTREZID = row.names(.)) %>%
pivot_longer(cols = !ENTREZID, names_to = "sample", values_to = "counts") %>%
separate("sample", into = c("trt","ind","time")) %>%
mutate(time=factor(time, levels = c("3h","24h"))) %>%
mutate(trt=factor(trt, levels= c("DOX","EPI","DNR","MTX","TRZ","VEH"))) %>%
ggplot(., aes (x = time, y=counts))+
geom_boxplot(aes(fill=trt))+
ggtitle(paste(ARFGEF1_peak$RNA," RNA expression"))+
scale_fill_manual(values = drug_pal)+
theme_bw()+
ylab("log2 cpm RNA")
| Version | Author | Date |
|---|---|---|
| c959920 | reneeisnowhere | 2024-10-28 |
plotpanelATAC <- ATAC_counts %>%
  cpm(., log = TRUE) %>%
   as.data.frame() %>%
  rename_with(.,~gsub(pattern = "Ind1_75", replacement = "1_",.)) %>%
  rename_with(.,~gsub(pattern = "Ind2_87", replacement = "2_",.)) %>%
  rename_with(.,~gsub(pattern = "Ind3_77", replacement = "3_",.)) %>%
  rename_with(.,~gsub(pattern = "Ind6_71", replacement = "6_",.)) %>%
  rename_with(.,~gsub( "DX" ,'DOX',.)) %>%
  rename_with(.,~gsub( "DA" ,'DNR',.)) %>%
  rename_with(.,~gsub( "E" ,'EPI',.)) %>%
  rename_with(.,~gsub( "T" ,'TRZ',.)) %>%
  rename_with(.,~gsub( "M" ,'MTX',.)) %>%
  rename_with(.,~gsub( "V" ,'VEH',.)) %>%
  rename_with(.,~gsub("24h","_24h",.)) %>%
  rename_with(.,~gsub("3h","_3h",.))

plotpanelATAC %>%
  dplyr::filter(row.names(.) %in% ARFGEF1_peak$peak) %>%
  mutate(Peakid = row.names(.)) %>%
  pivot_longer(cols = !Peakid, names_to = "sample", values_to = "counts") %>%
  separate("sample", into = c("ind","trt","time")) %>%
  mutate(time=factor(time, levels = c("3h","24h"))) %>%
  mutate(trt=factor(trt, levels= c("DOX","EPI","DNR","MTX","TRZ","VEH"))) %>%
   ggplot(., aes (x = time, y=counts))+
  geom_boxplot(aes(fill=trt))+
  ggtitle(paste(ARFGEF1_peak$RNA," gene and \n",ARFGEF1_peak$peak," ATAC accessibility"))+
  scale_fill_manual(values = drug_pal)+
  theme_bw()+
  ylab("log2 cpm ATAC")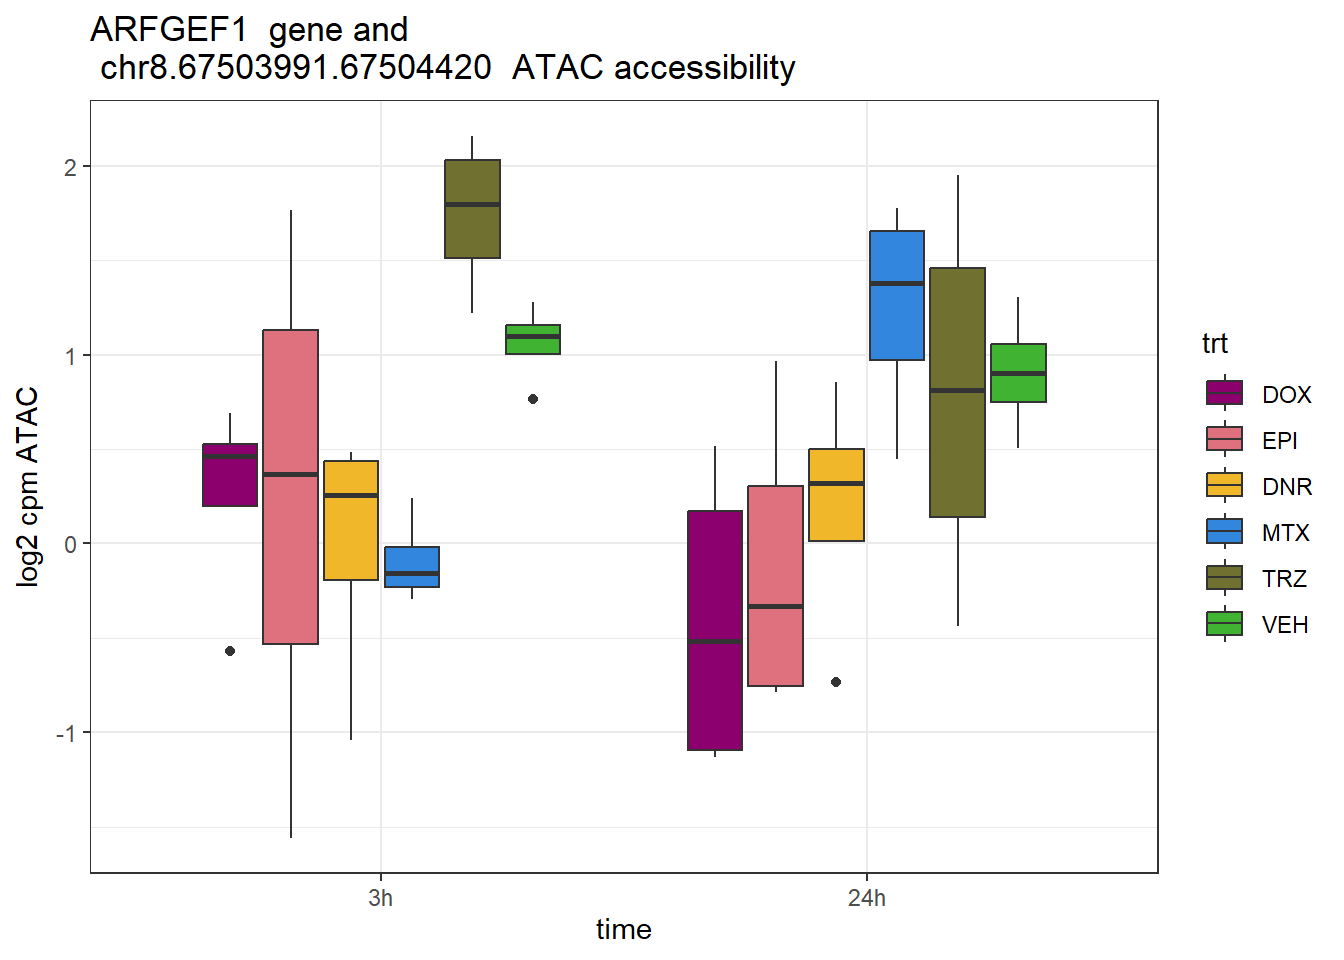
| Version | Author | Date |
|---|---|---|
| c959920 | reneeisnowhere | 2024-10-28 |
sessionInfo()R version 4.4.1 (2024-06-14 ucrt)
Platform: x86_64-w64-mingw32/x64
Running under: Windows 10 x64 (build 19045)
Matrix products: default
locale:
[1] LC_COLLATE=English_United States.utf8
[2] LC_CTYPE=English_United States.utf8
[3] LC_MONETARY=English_United States.utf8
[4] LC_NUMERIC=C
[5] LC_TIME=English_United States.utf8
time zone: America/Chicago
tzcode source: internal
attached base packages:
[1] grid stats4 stats graphics grDevices utils datasets
[8] methods base
other attached packages:
[1] readxl_1.4.3
[2] smplot2_0.2.4
[3] cowplot_1.1.3
[4] ComplexHeatmap_2.20.0
[5] ggrepel_0.9.6
[6] plyranges_1.24.0
[7] ggsignif_0.6.4
[8] genomation_1.36.0
[9] edgeR_4.2.1
[10] limma_3.60.4
[11] ggpubr_0.6.0
[12] BiocParallel_1.38.0
[13] ggVennDiagram_1.5.2
[14] scales_1.3.0
[15] VennDiagram_1.7.3
[16] futile.logger_1.4.3
[17] gridExtra_2.3
[18] ggfortify_0.4.17
[19] rtracklayer_1.64.0
[20] org.Hs.eg.db_3.19.1
[21] TxDb.Hsapiens.UCSC.hg38.knownGene_3.18.0
[22] GenomicFeatures_1.56.0
[23] AnnotationDbi_1.66.0
[24] Biobase_2.64.0
[25] GenomicRanges_1.56.1
[26] GenomeInfoDb_1.40.1
[27] IRanges_2.38.1
[28] S4Vectors_0.42.1
[29] BiocGenerics_0.50.0
[30] RColorBrewer_1.1-3
[31] broom_1.0.7
[32] kableExtra_1.4.0
[33] lubridate_1.9.3
[34] forcats_1.0.0
[35] stringr_1.5.1
[36] dplyr_1.1.4
[37] purrr_1.0.2
[38] readr_2.1.5
[39] tidyr_1.3.1
[40] tibble_3.2.1
[41] ggplot2_3.5.1
[42] tidyverse_2.0.0
[43] workflowr_1.7.1
loaded via a namespace (and not attached):
[1] later_1.3.2 BiocIO_1.14.0
[3] bitops_1.0-9 cellranger_1.1.0
[5] rpart_4.1.23 XML_3.99-0.17
[7] lifecycle_1.0.4 rstatix_0.7.2
[9] doParallel_1.0.17 rprojroot_2.0.4
[11] vroom_1.6.5 processx_3.8.4
[13] lattice_0.22-6 backports_1.5.0
[15] magrittr_2.0.3 Hmisc_5.2-0
[17] sass_0.4.9 rmarkdown_2.29
[19] jquerylib_0.1.4 yaml_2.3.10
[21] plotrix_3.8-4 httpuv_1.6.15
[23] DBI_1.2.3 abind_1.4-8
[25] zlibbioc_1.50.0 RCurl_1.98-1.16
[27] nnet_7.3-19 git2r_0.35.0
[29] circlize_0.4.16 GenomeInfoDbData_1.2.12
[31] svglite_2.1.3 codetools_0.2-20
[33] DelayedArray_0.30.1 xml2_1.3.6
[35] tidyselect_1.2.1 shape_1.4.6.1
[37] farver_2.1.2 UCSC.utils_1.0.0
[39] base64enc_0.1-3 matrixStats_1.4.1
[41] GenomicAlignments_1.40.0 jsonlite_1.8.9
[43] GetoptLong_1.0.5 Formula_1.2-5
[45] iterators_1.0.14 systemfonts_1.1.0
[47] foreach_1.5.2 tools_4.4.1
[49] Rcpp_1.0.13-1 glue_1.8.0
[51] SparseArray_1.4.8 xfun_0.49
[53] MatrixGenerics_1.16.0 withr_3.0.2
[55] formatR_1.14 fastmap_1.2.0
[57] fansi_1.0.6 callr_3.7.6
[59] digest_0.6.37 timechange_0.3.0
[61] R6_2.5.1 seqPattern_1.36.0
[63] colorspace_2.1-1 RSQLite_2.3.7
[65] utf8_1.2.4 generics_0.1.3
[67] data.table_1.16.2 htmlwidgets_1.6.4
[69] httr_1.4.7 S4Arrays_1.4.1
[71] whisker_0.4.1 pkgconfig_2.0.3
[73] gtable_0.3.6 blob_1.2.4
[75] impute_1.78.0 XVector_0.44.0
[77] htmltools_0.5.8.1 carData_3.0-5
[79] pwr_1.3-0 clue_0.3-66
[81] png_0.1-8 knitr_1.49
[83] lambda.r_1.2.4 rstudioapi_0.17.1
[85] tzdb_0.4.0 reshape2_1.4.4
[87] rjson_0.2.23 checkmate_2.3.2
[89] curl_6.0.1 zoo_1.8-12
[91] cachem_1.1.0 GlobalOptions_0.1.2
[93] KernSmooth_2.23-24 parallel_4.4.1
[95] foreign_0.8-87 restfulr_0.0.15
[97] pillar_1.9.0 vctrs_0.6.5
[99] promises_1.3.0 car_3.1-3
[101] cluster_2.1.6 htmlTable_2.4.3
[103] evaluate_1.0.1 magick_2.8.5
[105] cli_3.6.3 locfit_1.5-9.10
[107] compiler_4.4.1 futile.options_1.0.1
[109] Rsamtools_2.20.0 rlang_1.1.4
[111] crayon_1.5.3 labeling_0.4.3
[113] ps_1.8.1 getPass_0.2-4
[115] plyr_1.8.9 fs_1.6.5
[117] stringi_1.8.4 viridisLite_0.4.2
[119] gridBase_0.4-7 munsell_0.5.1
[121] Biostrings_2.72.1 Matrix_1.7-1
[123] BSgenome_1.72.0 patchwork_1.3.0
[125] hms_1.1.3 bit64_4.5.2
[127] KEGGREST_1.44.1 statmod_1.5.0
[129] SummarizedExperiment_1.34.0 memoise_2.0.1
[131] bslib_0.8.0 bit_4.5.0